Cajun vs Ukrainian 1 or more Vehicles in Household
COMPARE
Cajun
Ukrainian
1 or more Vehicles in Household
1 or more Vehicles in Household Comparison
Cajuns
Ukrainians
91.7%
1 OR MORE VEHICLES IN HOUSEHOLD
99.7/ 100
METRIC RATING
72nd/ 347
METRIC RANK
89.6%
1 OR MORE VEHICLES IN HOUSEHOLD
42.4/ 100
METRIC RATING
182nd/ 347
METRIC RANK
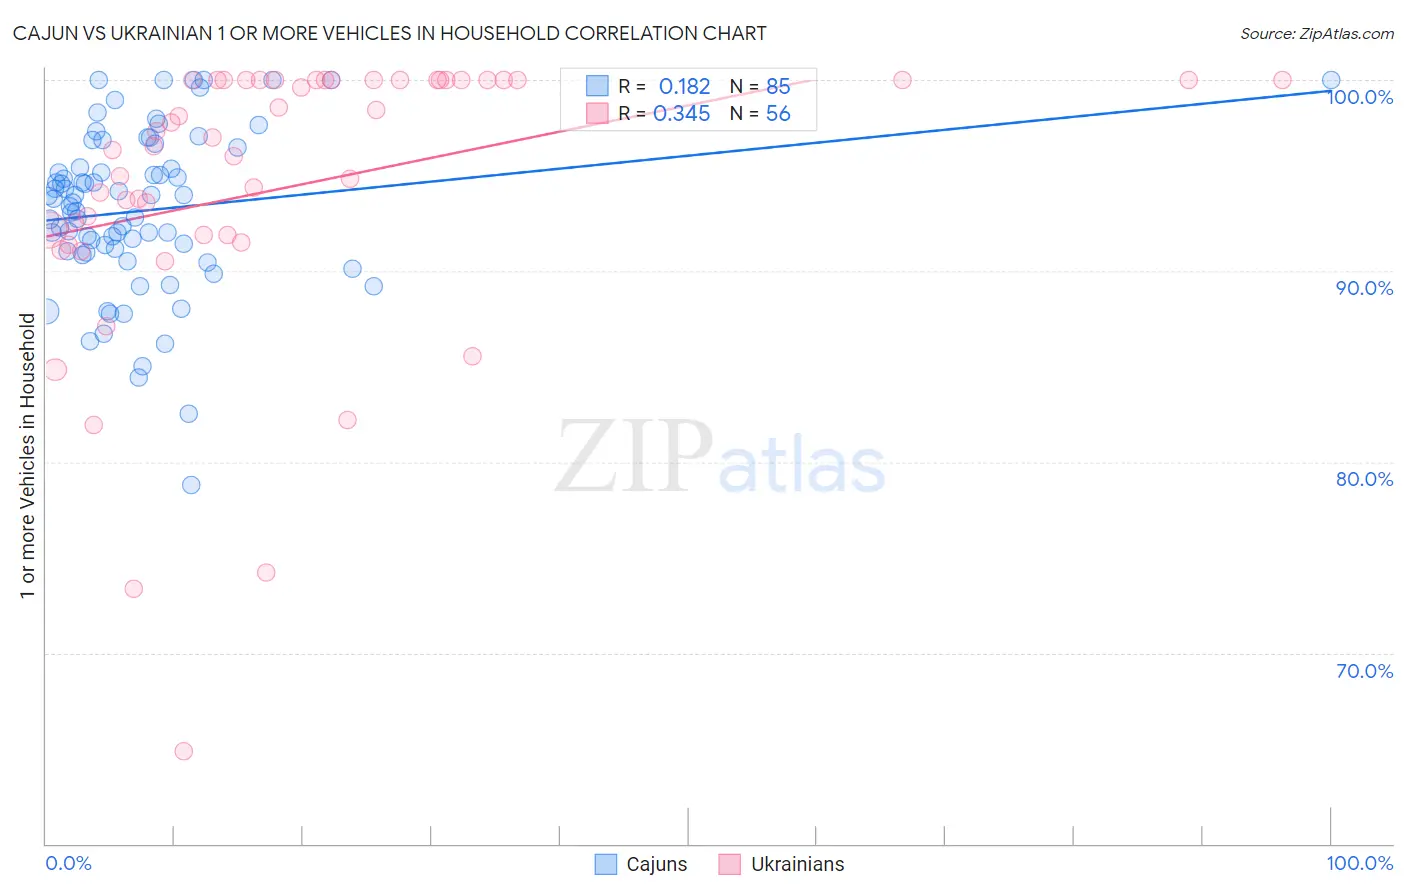
Cajun vs Ukrainian 1 or more Vehicles in Household Correlation Chart
The statistical analysis conducted on geographies consisting of 149,696,073 people shows a poor positive correlation between the proportion of Cajuns and percentage of households with 1 or more vehicles available in the United States with a correlation coefficient (R) of 0.182 and weighted average of 91.7%. Similarly, the statistical analysis conducted on geographies consisting of 448,299,681 people shows a mild positive correlation between the proportion of Ukrainians and percentage of households with 1 or more vehicles available in the United States with a correlation coefficient (R) of 0.345 and weighted average of 89.6%, a difference of 2.3%.
1 or more Vehicles in Household Correlation Summary
| Measurement | Cajun | Ukrainian |
| Minimum | 78.8% | 64.9% |
| Maximum | 100.0% | 100.0% |
| Range | 21.2% | 35.1% |
| Mean | 93.2% | 94.4% |
| Median | 93.6% | 96.8% |
| Interquartile 25% (IQ1) | 91.0% | 91.9% |
| Interquartile 75% (IQ3) | 96.0% | 100.0% |
| Interquartile Range (IQR) | 4.9% | 8.1% |
| Standard Deviation (Sample) | 4.3% | 7.5% |
| Standard Deviation (Population) | 4.2% | 7.4% |
Similar Demographics by 1 or more Vehicles in Household
Demographics Similar to Cajuns by 1 or more Vehicles in Household
In terms of 1 or more vehicles in household, the demographic groups most similar to Cajuns are Polish (91.7%, a difference of 0.0%), Immigrants from Iran (91.7%, a difference of 0.010%), Lithuanian (91.7%, a difference of 0.020%), Palestinian (91.7%, a difference of 0.040%), and Immigrants from Lebanon (91.6%, a difference of 0.050%).
| Demographics | Rating | Rank | 1 or more Vehicles in Household |
| Immigrants | Laos | 99.8 /100 | #65 | Exceptional 91.8% |
| Canadians | 99.8 /100 | #66 | Exceptional 91.8% |
| Spaniards | 99.8 /100 | #67 | Exceptional 91.8% |
| Immigrants | Scotland | 99.7 /100 | #68 | Exceptional 91.8% |
| Palestinians | 99.7 /100 | #69 | Exceptional 91.7% |
| Lithuanians | 99.7 /100 | #70 | Exceptional 91.7% |
| Poles | 99.7 /100 | #71 | Exceptional 91.7% |
| Cajuns | 99.7 /100 | #72 | Exceptional 91.7% |
| Immigrants | Iran | 99.7 /100 | #73 | Exceptional 91.7% |
| Immigrants | Lebanon | 99.6 /100 | #74 | Exceptional 91.6% |
| Portuguese | 99.5 /100 | #75 | Exceptional 91.6% |
| Cubans | 99.5 /100 | #76 | Exceptional 91.5% |
| Immigrants | Philippines | 99.4 /100 | #77 | Exceptional 91.5% |
| Iranians | 99.4 /100 | #78 | Exceptional 91.5% |
| Immigrants | South Central Asia | 99.4 /100 | #79 | Exceptional 91.5% |
Demographics Similar to Ukrainians by 1 or more Vehicles in Household
In terms of 1 or more vehicles in household, the demographic groups most similar to Ukrainians are Immigrants from Ethiopia (89.6%, a difference of 0.0%), Arab (89.6%, a difference of 0.010%), Ethiopian (89.6%, a difference of 0.020%), Immigrants from El Salvador (89.6%, a difference of 0.030%), and German Russian (89.6%, a difference of 0.030%).
| Demographics | Rating | Rank | 1 or more Vehicles in Household |
| Immigrants | Burma/Myanmar | 47.6 /100 | #175 | Average 89.7% |
| Immigrants | Sudan | 47.1 /100 | #176 | Average 89.7% |
| Hmong | 45.8 /100 | #177 | Average 89.6% |
| Immigrants | El Salvador | 44.1 /100 | #178 | Average 89.6% |
| German Russians | 44.0 /100 | #179 | Average 89.6% |
| Arabs | 43.3 /100 | #180 | Average 89.6% |
| Immigrants | Ethiopia | 42.5 /100 | #181 | Average 89.6% |
| Ukrainians | 42.4 /100 | #182 | Average 89.6% |
| Ethiopians | 41.2 /100 | #183 | Average 89.6% |
| Immigrants | Bulgaria | 40.7 /100 | #184 | Average 89.6% |
| Immigrants | Brazil | 40.1 /100 | #185 | Average 89.6% |
| Pueblo | 39.9 /100 | #186 | Fair 89.6% |
| South Americans | 39.6 /100 | #187 | Fair 89.5% |
| Immigrants | Nepal | 38.9 /100 | #188 | Fair 89.5% |
| Carpatho Rusyns | 37.8 /100 | #189 | Fair 89.5% |