Cajun vs Immigrants from Ireland 1 or more Vehicles in Household
COMPARE
Cajun
Immigrants from Ireland
1 or more Vehicles in Household
1 or more Vehicles in Household Comparison
Cajuns
Immigrants from Ireland
91.7%
1 OR MORE VEHICLES IN HOUSEHOLD
99.7/ 100
METRIC RATING
72nd/ 347
METRIC RANK
86.4%
1 OR MORE VEHICLES IN HOUSEHOLD
0.0/ 100
METRIC RATING
289th/ 347
METRIC RANK
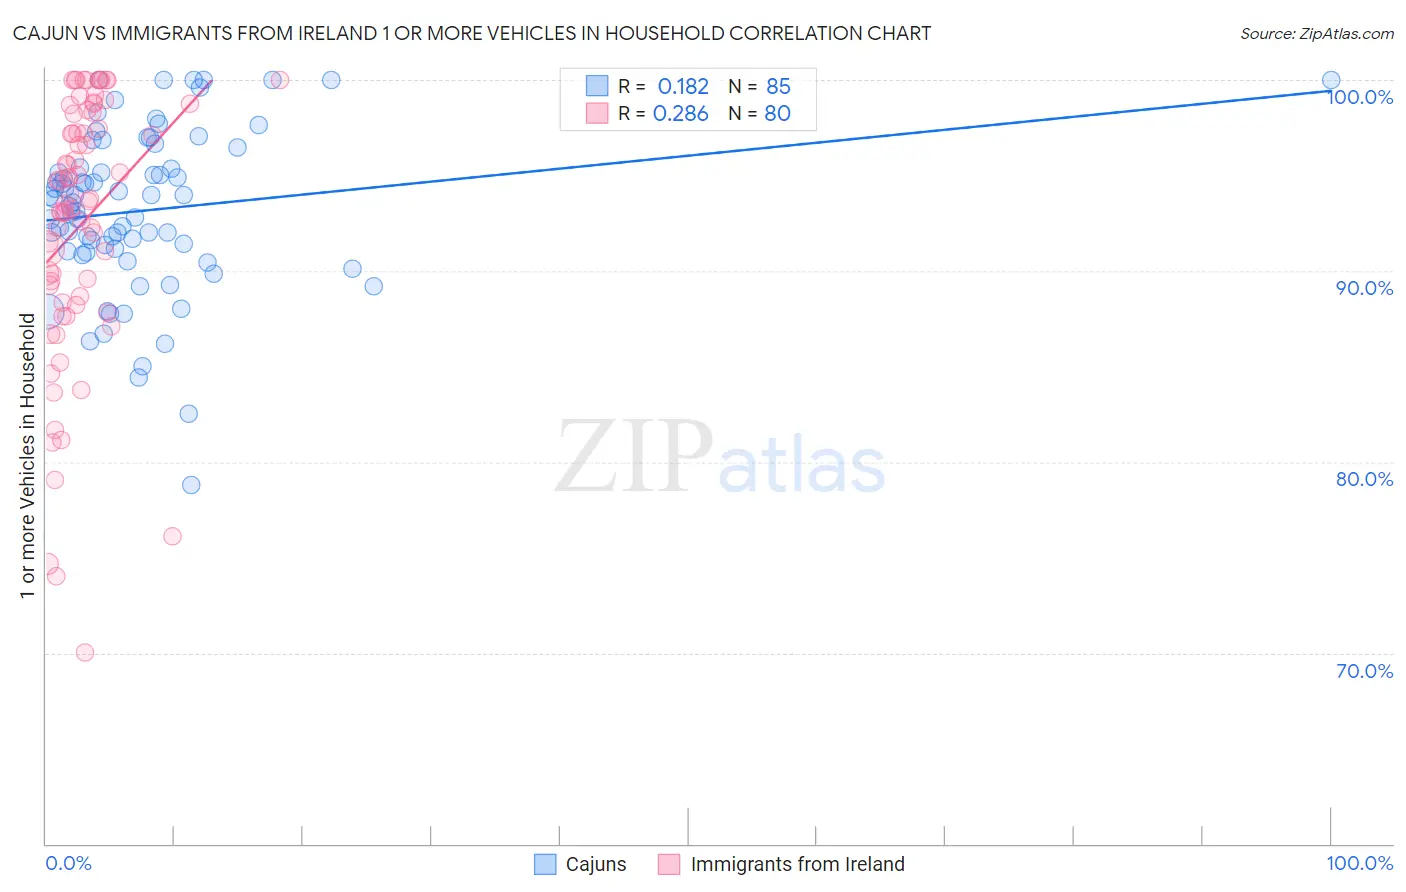
Cajun vs Immigrants from Ireland 1 or more Vehicles in Household Correlation Chart
The statistical analysis conducted on geographies consisting of 149,696,073 people shows a poor positive correlation between the proportion of Cajuns and percentage of households with 1 or more vehicles available in the United States with a correlation coefficient (R) of 0.182 and weighted average of 91.7%. Similarly, the statistical analysis conducted on geographies consisting of 240,751,818 people shows a weak positive correlation between the proportion of Immigrants from Ireland and percentage of households with 1 or more vehicles available in the United States with a correlation coefficient (R) of 0.286 and weighted average of 86.4%, a difference of 6.1%.
1 or more Vehicles in Household Correlation Summary
| Measurement | Cajun | Immigrants from Ireland |
| Minimum | 78.8% | 70.0% |
| Maximum | 100.0% | 100.0% |
| Range | 21.2% | 30.0% |
| Mean | 93.2% | 92.4% |
| Median | 93.6% | 93.7% |
| Interquartile 25% (IQ1) | 91.0% | 88.5% |
| Interquartile 75% (IQ3) | 96.0% | 98.3% |
| Interquartile Range (IQR) | 4.9% | 9.8% |
| Standard Deviation (Sample) | 4.3% | 6.9% |
| Standard Deviation (Population) | 4.2% | 6.9% |
Similar Demographics by 1 or more Vehicles in Household
Demographics Similar to Cajuns by 1 or more Vehicles in Household
In terms of 1 or more vehicles in household, the demographic groups most similar to Cajuns are Polish (91.7%, a difference of 0.0%), Immigrants from Iran (91.7%, a difference of 0.010%), Lithuanian (91.7%, a difference of 0.020%), Palestinian (91.7%, a difference of 0.040%), and Immigrants from Lebanon (91.6%, a difference of 0.050%).
| Demographics | Rating | Rank | 1 or more Vehicles in Household |
| Immigrants | Laos | 99.8 /100 | #65 | Exceptional 91.8% |
| Canadians | 99.8 /100 | #66 | Exceptional 91.8% |
| Spaniards | 99.8 /100 | #67 | Exceptional 91.8% |
| Immigrants | Scotland | 99.7 /100 | #68 | Exceptional 91.8% |
| Palestinians | 99.7 /100 | #69 | Exceptional 91.7% |
| Lithuanians | 99.7 /100 | #70 | Exceptional 91.7% |
| Poles | 99.7 /100 | #71 | Exceptional 91.7% |
| Cajuns | 99.7 /100 | #72 | Exceptional 91.7% |
| Immigrants | Iran | 99.7 /100 | #73 | Exceptional 91.7% |
| Immigrants | Lebanon | 99.6 /100 | #74 | Exceptional 91.6% |
| Portuguese | 99.5 /100 | #75 | Exceptional 91.6% |
| Cubans | 99.5 /100 | #76 | Exceptional 91.5% |
| Immigrants | Philippines | 99.4 /100 | #77 | Exceptional 91.5% |
| Iranians | 99.4 /100 | #78 | Exceptional 91.5% |
| Immigrants | South Central Asia | 99.4 /100 | #79 | Exceptional 91.5% |
Demographics Similar to Immigrants from Ireland by 1 or more Vehicles in Household
In terms of 1 or more vehicles in household, the demographic groups most similar to Immigrants from Ireland are Hopi (86.4%, a difference of 0.020%), Immigrants from Australia (86.4%, a difference of 0.040%), Immigrants from Malaysia (86.5%, a difference of 0.090%), Pima (86.3%, a difference of 0.12%), and Immigrants from Eastern Asia (86.5%, a difference of 0.16%).
| Demographics | Rating | Rank | 1 or more Vehicles in Household |
| Colville | 0.0 /100 | #282 | Tragic 86.8% |
| Immigrants | Eastern Europe | 0.0 /100 | #283 | Tragic 86.7% |
| Central American Indians | 0.0 /100 | #284 | Tragic 86.7% |
| Immigrants | Kazakhstan | 0.0 /100 | #285 | Tragic 86.6% |
| Immigrants | Eastern Asia | 0.0 /100 | #286 | Tragic 86.5% |
| Immigrants | Malaysia | 0.0 /100 | #287 | Tragic 86.5% |
| Hopi | 0.0 /100 | #288 | Tragic 86.4% |
| Immigrants | Ireland | 0.0 /100 | #289 | Tragic 86.4% |
| Immigrants | Australia | 0.0 /100 | #290 | Tragic 86.4% |
| Pima | 0.0 /100 | #291 | Tragic 86.3% |
| Okinawans | 0.0 /100 | #292 | Tragic 86.1% |
| Indians (Asian) | 0.0 /100 | #293 | Tragic 86.0% |
| Alaskan Athabascans | 0.0 /100 | #294 | Tragic 86.0% |
| Immigrants | Jamaica | 0.0 /100 | #295 | Tragic 85.8% |
| Immigrants | Spain | 0.0 /100 | #296 | Tragic 85.8% |