Bulgarian vs Immigrants from Ghana In Labor Force | Age 16-19
COMPARE
Bulgarian
Immigrants from Ghana
In Labor Force | Age 16-19
In Labor Force | Age 16-19 Comparison
Bulgarians
Immigrants from Ghana
38.3%
IN LABOR FORCE | AGE 16-19
97.9/ 100
METRIC RATING
115th/ 347
METRIC RANK
35.4%
IN LABOR FORCE | AGE 16-19
7.3/ 100
METRIC RATING
222nd/ 347
METRIC RANK
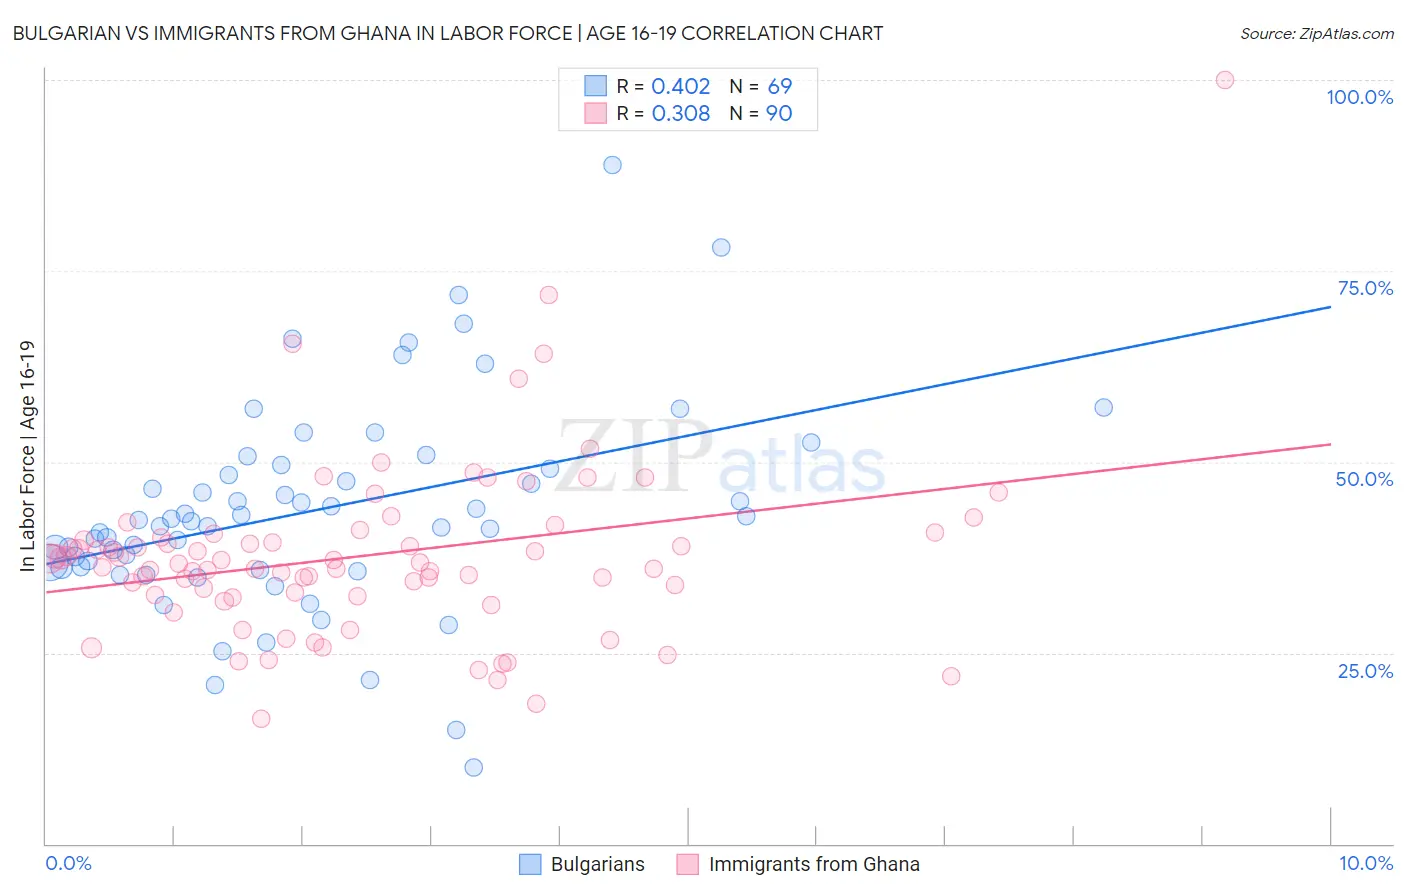
Bulgarian vs Immigrants from Ghana In Labor Force | Age 16-19 Correlation Chart
The statistical analysis conducted on geographies consisting of 205,432,687 people shows a moderate positive correlation between the proportion of Bulgarians and labor force participation rate among population between the ages 16 and 19 in the United States with a correlation coefficient (R) of 0.402 and weighted average of 38.3%. Similarly, the statistical analysis conducted on geographies consisting of 199,826,706 people shows a mild positive correlation between the proportion of Immigrants from Ghana and labor force participation rate among population between the ages 16 and 19 in the United States with a correlation coefficient (R) of 0.308 and weighted average of 35.4%, a difference of 8.3%.
In Labor Force | Age 16-19 Correlation Summary
| Measurement | Bulgarian | Immigrants from Ghana |
| Minimum | 10.0% | 16.3% |
| Maximum | 88.9% | 100.0% |
| Range | 78.9% | 83.7% |
| Mean | 43.6% | 37.7% |
| Median | 42.3% | 36.7% |
| Interquartile 25% (IQ1) | 36.2% | 32.5% |
| Interquartile 75% (IQ3) | 49.3% | 40.1% |
| Interquartile Range (IQR) | 13.1% | 7.5% |
| Standard Deviation (Sample) | 13.7% | 11.6% |
| Standard Deviation (Population) | 13.6% | 11.6% |
Similar Demographics by In Labor Force | Age 16-19
Demographics Similar to Bulgarians by In Labor Force | Age 16-19
In terms of in labor force | age 16-19, the demographic groups most similar to Bulgarians are Colville (38.3%, a difference of 0.010%), Chickasaw (38.3%, a difference of 0.060%), Immigrants from Nepal (38.3%, a difference of 0.070%), Assyrian/Chaldean/Syriac (38.3%, a difference of 0.080%), and Hawaiian (38.4%, a difference of 0.15%).
| Demographics | Rating | Rank | In Labor Force | Age 16-19 |
| Immigrants | Ethiopia | 98.7 /100 | #108 | Exceptional 38.6% |
| Lebanese | 98.7 /100 | #109 | Exceptional 38.6% |
| Maltese | 98.6 /100 | #110 | Exceptional 38.5% |
| Crow | 98.5 /100 | #111 | Exceptional 38.5% |
| Immigrants | Scotland | 98.5 /100 | #112 | Exceptional 38.5% |
| Sub-Saharan Africans | 98.3 /100 | #113 | Exceptional 38.4% |
| Hawaiians | 98.2 /100 | #114 | Exceptional 38.4% |
| Bulgarians | 97.9 /100 | #115 | Exceptional 38.3% |
| Colville | 97.9 /100 | #116 | Exceptional 38.3% |
| Chickasaw | 97.8 /100 | #117 | Exceptional 38.3% |
| Immigrants | Nepal | 97.8 /100 | #118 | Exceptional 38.3% |
| Assyrians/Chaldeans/Syriacs | 97.8 /100 | #119 | Exceptional 38.3% |
| Ukrainians | 97.6 /100 | #120 | Exceptional 38.3% |
| Ethiopians | 97.4 /100 | #121 | Exceptional 38.2% |
| Guamanians/Chamorros | 97.4 /100 | #122 | Exceptional 38.2% |
Demographics Similar to Immigrants from Ghana by In Labor Force | Age 16-19
In terms of in labor force | age 16-19, the demographic groups most similar to Immigrants from Ghana are Turkish (35.4%, a difference of 0.010%), Ghanaian (35.3%, a difference of 0.15%), Honduran (35.3%, a difference of 0.16%), Immigrants from Bahamas (35.5%, a difference of 0.19%), and Guatemalan (35.5%, a difference of 0.24%).
| Demographics | Rating | Rank | In Labor Force | Age 16-19 |
| Immigrants | South Eastern Asia | 10.8 /100 | #215 | Poor 35.6% |
| Dutch West Indians | 10.7 /100 | #216 | Poor 35.6% |
| Immigrants | Costa Rica | 10.7 /100 | #217 | Poor 35.6% |
| Sri Lankans | 9.8 /100 | #218 | Tragic 35.5% |
| Guatemalans | 8.6 /100 | #219 | Tragic 35.5% |
| Immigrants | Bahamas | 8.3 /100 | #220 | Tragic 35.5% |
| Turks | 7.3 /100 | #221 | Tragic 35.4% |
| Immigrants | Ghana | 7.3 /100 | #222 | Tragic 35.4% |
| Ghanaians | 6.5 /100 | #223 | Tragic 35.3% |
| Hondurans | 6.5 /100 | #224 | Tragic 35.3% |
| Immigrants | Belgium | 6.1 /100 | #225 | Tragic 35.3% |
| Immigrants | Guatemala | 5.7 /100 | #226 | Tragic 35.3% |
| Mongolians | 5.7 /100 | #227 | Tragic 35.3% |
| Immigrants | Senegal | 5.5 /100 | #228 | Tragic 35.3% |
| Immigrants | Lebanon | 5.0 /100 | #229 | Tragic 35.2% |