Bulgarian vs Ute 1 or more Vehicles in Household
COMPARE
Bulgarian
Ute
1 or more Vehicles in Household
1 or more Vehicles in Household Comparison
Bulgarians
Ute
91.1%
1 OR MORE VEHICLES IN HOUSEHOLD
98.4/ 100
METRIC RATING
101st/ 347
METRIC RANK
88.7%
1 OR MORE VEHICLES IN HOUSEHOLD
5.6/ 100
METRIC RATING
227th/ 347
METRIC RANK
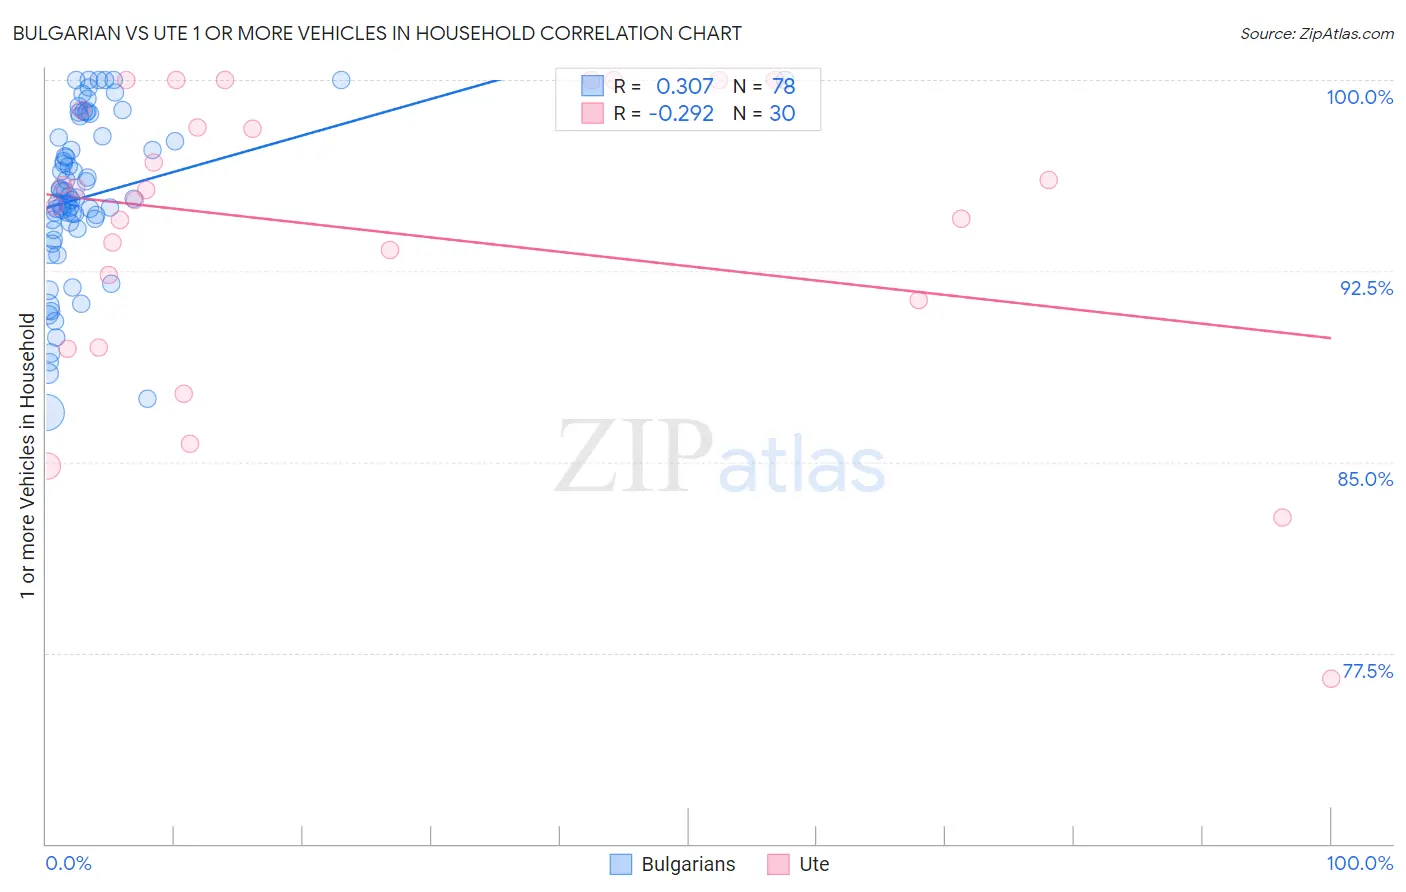
Bulgarian vs Ute 1 or more Vehicles in Household Correlation Chart
The statistical analysis conducted on geographies consisting of 205,574,204 people shows a mild positive correlation between the proportion of Bulgarians and percentage of households with 1 or more vehicles available in the United States with a correlation coefficient (R) of 0.307 and weighted average of 91.1%. Similarly, the statistical analysis conducted on geographies consisting of 55,668,072 people shows a weak negative correlation between the proportion of Ute and percentage of households with 1 or more vehicles available in the United States with a correlation coefficient (R) of -0.292 and weighted average of 88.7%, a difference of 2.7%.
1 or more Vehicles in Household Correlation Summary
| Measurement | Bulgarian | Ute |
| Minimum | 86.9% | 76.5% |
| Maximum | 100.0% | 100.0% |
| Range | 13.1% | 23.5% |
| Mean | 95.5% | 94.1% |
| Median | 95.4% | 95.5% |
| Interquartile 25% (IQ1) | 94.1% | 91.4% |
| Interquartile 75% (IQ3) | 97.8% | 98.8% |
| Interquartile Range (IQR) | 3.7% | 7.5% |
| Standard Deviation (Sample) | 3.2% | 5.9% |
| Standard Deviation (Population) | 3.2% | 5.8% |
Similar Demographics by 1 or more Vehicles in Household
Demographics Similar to Bulgarians by 1 or more Vehicles in Household
In terms of 1 or more vehicles in household, the demographic groups most similar to Bulgarians are Immigrants from Central America (91.1%, a difference of 0.010%), Seminole (91.1%, a difference of 0.020%), Yugoslavian (91.1%, a difference of 0.030%), Asian (91.1%, a difference of 0.040%), and Immigrants from Bolivia (91.2%, a difference of 0.050%).
| Demographics | Rating | Rank | 1 or more Vehicles in Household |
| Immigrants | Cuba | 99.1 /100 | #94 | Exceptional 91.3% |
| Austrians | 99.0 /100 | #95 | Exceptional 91.3% |
| Potawatomi | 99.0 /100 | #96 | Exceptional 91.3% |
| Pakistanis | 99.0 /100 | #97 | Exceptional 91.3% |
| Slavs | 98.7 /100 | #98 | Exceptional 91.2% |
| Immigrants | Bolivia | 98.6 /100 | #99 | Exceptional 91.2% |
| Immigrants | Central America | 98.4 /100 | #100 | Exceptional 91.1% |
| Bulgarians | 98.4 /100 | #101 | Exceptional 91.1% |
| Seminole | 98.3 /100 | #102 | Exceptional 91.1% |
| Yugoslavians | 98.3 /100 | #103 | Exceptional 91.1% |
| Asians | 98.2 /100 | #104 | Exceptional 91.1% |
| Laotians | 98.0 /100 | #105 | Exceptional 91.0% |
| Zimbabweans | 97.7 /100 | #106 | Exceptional 91.0% |
| Maltese | 97.7 /100 | #107 | Exceptional 91.0% |
| Hispanics or Latinos | 97.6 /100 | #108 | Exceptional 91.0% |
Demographics Similar to Ute by 1 or more Vehicles in Household
In terms of 1 or more vehicles in household, the demographic groups most similar to Ute are Cheyenne (88.7%, a difference of 0.0%), Immigrants from Norway (88.7%, a difference of 0.010%), Immigrants from Romania (88.7%, a difference of 0.020%), Cree (88.7%, a difference of 0.030%), and Immigrants from Sierra Leone (88.7%, a difference of 0.030%).
| Demographics | Rating | Rank | 1 or more Vehicles in Household |
| Immigrants | Zaire | 8.1 /100 | #220 | Tragic 88.8% |
| Peruvians | 7.9 /100 | #221 | Tragic 88.8% |
| Uruguayans | 7.0 /100 | #222 | Tragic 88.8% |
| Immigrants | South America | 7.0 /100 | #223 | Tragic 88.8% |
| Immigrants | Hong Kong | 6.2 /100 | #224 | Tragic 88.7% |
| Cree | 6.0 /100 | #225 | Tragic 88.7% |
| Cheyenne | 5.7 /100 | #226 | Tragic 88.7% |
| Ute | 5.6 /100 | #227 | Tragic 88.7% |
| Immigrants | Norway | 5.5 /100 | #228 | Tragic 88.7% |
| Immigrants | Romania | 5.4 /100 | #229 | Tragic 88.7% |
| Immigrants | Sierra Leone | 5.2 /100 | #230 | Tragic 88.7% |
| Russians | 5.0 /100 | #231 | Tragic 88.7% |
| Immigrants | Japan | 4.9 /100 | #232 | Tragic 88.7% |
| Houma | 4.8 /100 | #233 | Tragic 88.6% |
| Immigrants | Peru | 4.7 /100 | #234 | Tragic 88.6% |