Bulgarian vs Immigrants from Ghana 7th Grade
COMPARE
Bulgarian
Immigrants from Ghana
7th Grade
7th Grade Comparison
Bulgarians
Immigrants from Ghana
97.1%
7TH GRADE
99.9/ 100
METRIC RATING
47th/ 347
METRIC RANK
95.2%
7TH GRADE
0.3/ 100
METRIC RATING
266th/ 347
METRIC RANK
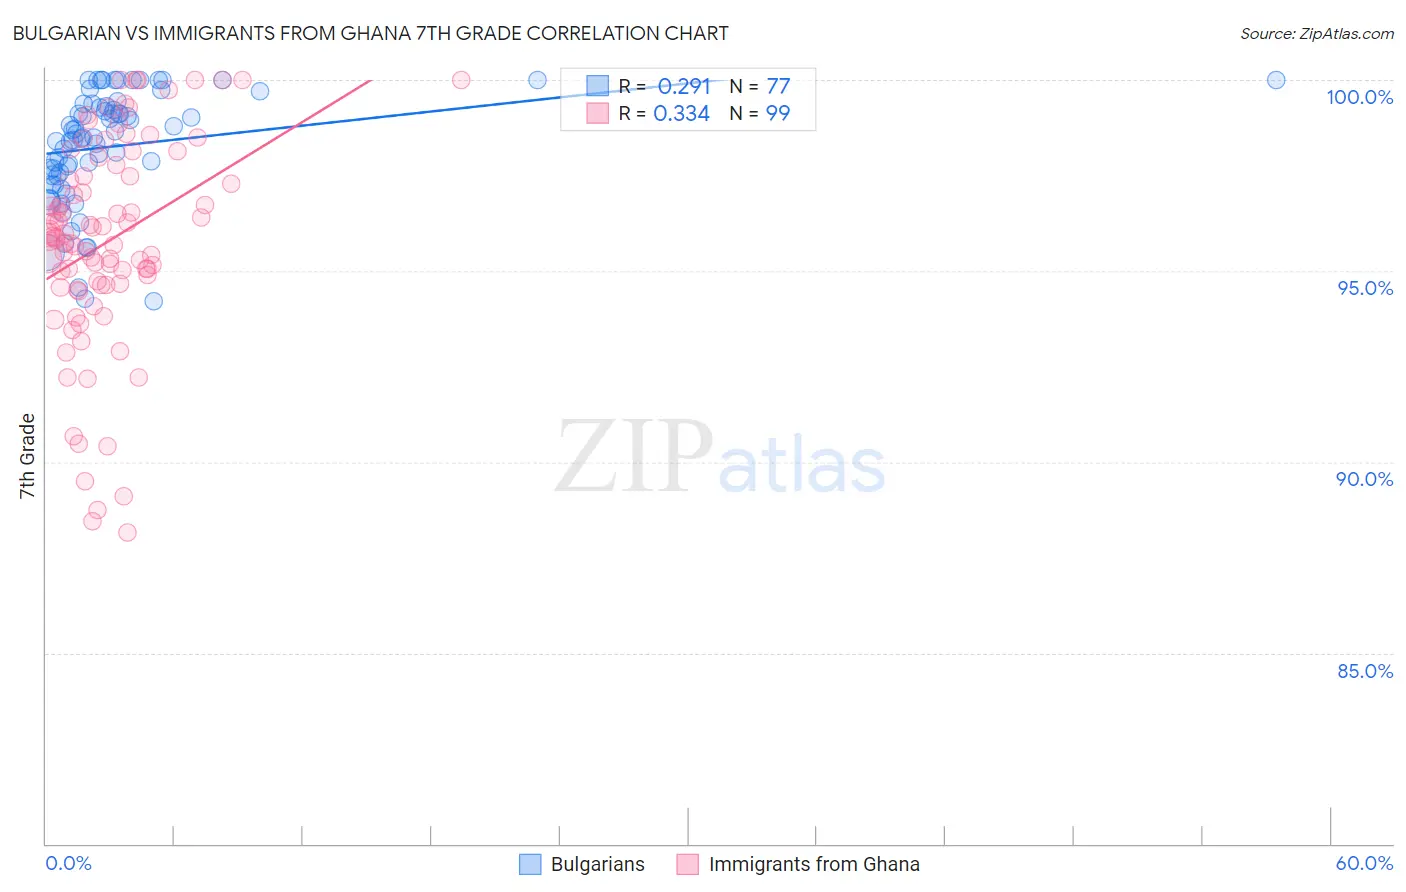
Bulgarian vs Immigrants from Ghana 7th Grade Correlation Chart
The statistical analysis conducted on geographies consisting of 205,632,052 people shows a weak positive correlation between the proportion of Bulgarians and percentage of population with at least 7th grade education in the United States with a correlation coefficient (R) of 0.291 and weighted average of 97.1%. Similarly, the statistical analysis conducted on geographies consisting of 199,952,023 people shows a mild positive correlation between the proportion of Immigrants from Ghana and percentage of population with at least 7th grade education in the United States with a correlation coefficient (R) of 0.334 and weighted average of 95.2%, a difference of 2.0%.
7th Grade Correlation Summary
| Measurement | Bulgarian | Immigrants from Ghana |
| Minimum | 94.2% | 88.2% |
| Maximum | 100.0% | 100.0% |
| Range | 5.8% | 11.8% |
| Mean | 98.3% | 95.8% |
| Median | 98.5% | 95.9% |
| Interquartile 25% (IQ1) | 97.5% | 94.6% |
| Interquartile 75% (IQ3) | 99.4% | 97.5% |
| Interquartile Range (IQR) | 1.9% | 2.8% |
| Standard Deviation (Sample) | 1.5% | 2.7% |
| Standard Deviation (Population) | 1.5% | 2.7% |
Similar Demographics by 7th Grade
Demographics Similar to Bulgarians by 7th Grade
In terms of 7th grade, the demographic groups most similar to Bulgarians are Celtic (97.1%, a difference of 0.010%), Slavic (97.1%, a difference of 0.010%), Aleut (97.1%, a difference of 0.020%), Immigrants from Scotland (97.1%, a difference of 0.020%), and Northern European (97.1%, a difference of 0.030%).
| Demographics | Rating | Rank | 7th Grade |
| Luxembourgers | 100.0 /100 | #40 | Exceptional 97.2% |
| Eastern Europeans | 100.0 /100 | #41 | Exceptional 97.2% |
| Chinese | 99.9 /100 | #42 | Exceptional 97.1% |
| Maltese | 99.9 /100 | #43 | Exceptional 97.1% |
| Northern Europeans | 99.9 /100 | #44 | Exceptional 97.1% |
| Czechoslovakians | 99.9 /100 | #45 | Exceptional 97.1% |
| Aleuts | 99.9 /100 | #46 | Exceptional 97.1% |
| Bulgarians | 99.9 /100 | #47 | Exceptional 97.1% |
| Celtics | 99.9 /100 | #48 | Exceptional 97.1% |
| Slavs | 99.9 /100 | #49 | Exceptional 97.1% |
| Immigrants | Scotland | 99.9 /100 | #50 | Exceptional 97.1% |
| Estonians | 99.9 /100 | #51 | Exceptional 97.0% |
| Greeks | 99.9 /100 | #52 | Exceptional 97.0% |
| Austrians | 99.8 /100 | #53 | Exceptional 97.0% |
| Australians | 99.8 /100 | #54 | Exceptional 97.0% |
Demographics Similar to Immigrants from Ghana by 7th Grade
In terms of 7th grade, the demographic groups most similar to Immigrants from Ghana are Immigrants from Uruguay (95.2%, a difference of 0.0%), Yuman (95.2%, a difference of 0.010%), Immigrants from Hong Kong (95.2%, a difference of 0.020%), Immigrants from Nigeria (95.2%, a difference of 0.040%), and Trinidadian and Tobagonian (95.2%, a difference of 0.040%).
| Demographics | Rating | Rank | 7th Grade |
| Immigrants | Costa Rica | 0.6 /100 | #259 | Tragic 95.3% |
| Afghans | 0.5 /100 | #260 | Tragic 95.3% |
| South Americans | 0.5 /100 | #261 | Tragic 95.2% |
| Immigrants | Somalia | 0.5 /100 | #262 | Tragic 95.2% |
| West Indians | 0.5 /100 | #263 | Tragic 95.2% |
| Immigrants | Nigeria | 0.4 /100 | #264 | Tragic 95.2% |
| Immigrants | Uruguay | 0.3 /100 | #265 | Tragic 95.2% |
| Immigrants | Ghana | 0.3 /100 | #266 | Tragic 95.2% |
| Yuman | 0.3 /100 | #267 | Tragic 95.2% |
| Immigrants | Hong Kong | 0.3 /100 | #268 | Tragic 95.2% |
| Trinidadians and Tobagonians | 0.3 /100 | #269 | Tragic 95.2% |
| Houma | 0.2 /100 | #270 | Tragic 95.1% |
| Immigrants | South America | 0.2 /100 | #271 | Tragic 95.1% |
| Peruvians | 0.2 /100 | #272 | Tragic 95.1% |
| Immigrants | Uzbekistan | 0.2 /100 | #273 | Tragic 95.1% |