Bulgarian vs Immigrants from Eastern Asia 1 or more Vehicles in Household
COMPARE
Bulgarian
Immigrants from Eastern Asia
1 or more Vehicles in Household
1 or more Vehicles in Household Comparison
Bulgarians
Immigrants from Eastern Asia
91.1%
1 OR MORE VEHICLES IN HOUSEHOLD
98.4/ 100
METRIC RATING
101st/ 347
METRIC RANK
86.5%
1 OR MORE VEHICLES IN HOUSEHOLD
0.0/ 100
METRIC RATING
286th/ 347
METRIC RANK
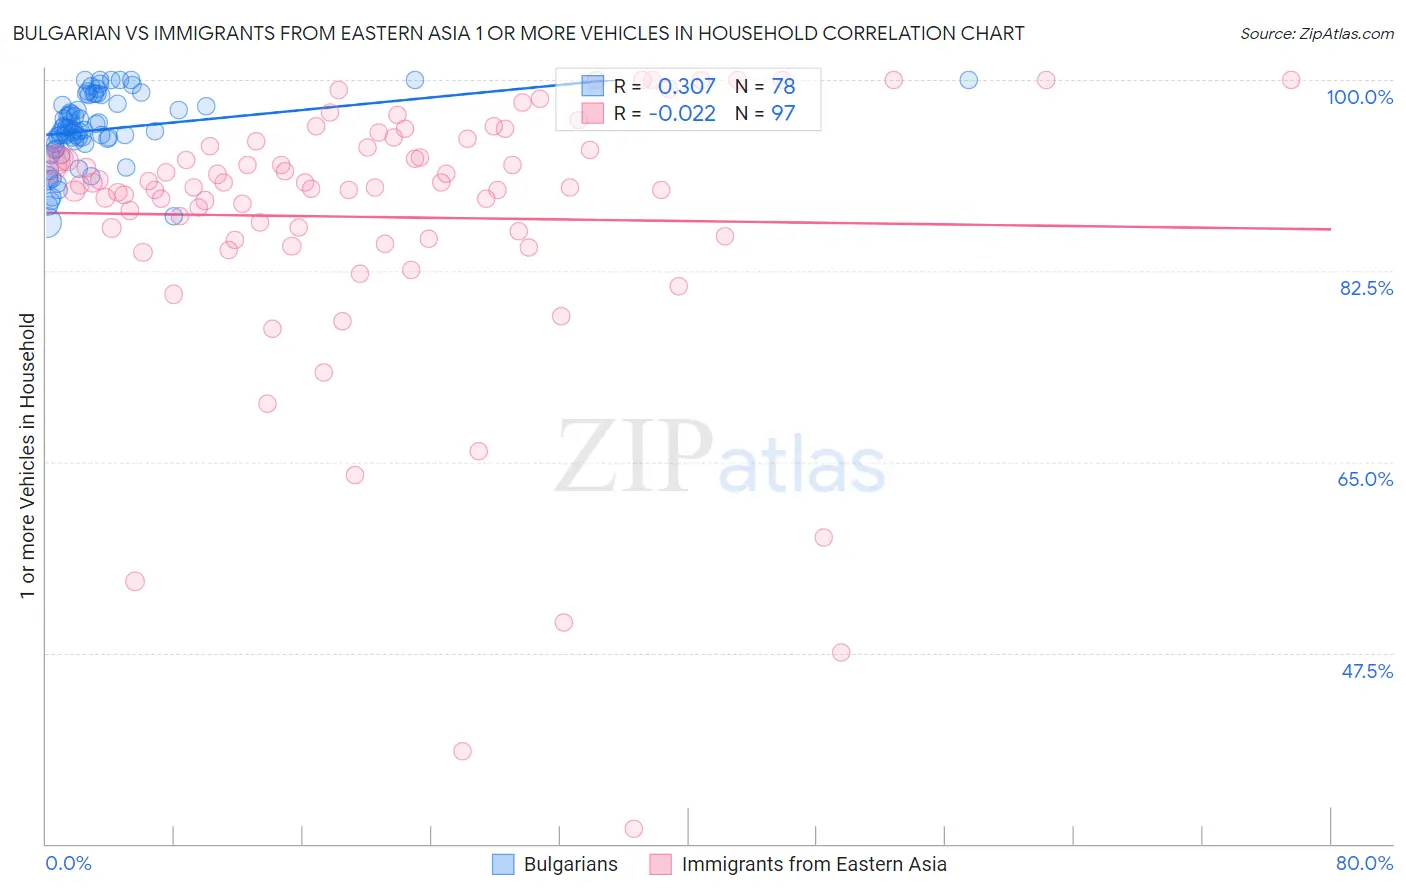
Bulgarian vs Immigrants from Eastern Asia 1 or more Vehicles in Household Correlation Chart
The statistical analysis conducted on geographies consisting of 205,574,204 people shows a mild positive correlation between the proportion of Bulgarians and percentage of households with 1 or more vehicles available in the United States with a correlation coefficient (R) of 0.307 and weighted average of 91.1%. Similarly, the statistical analysis conducted on geographies consisting of 499,412,711 people shows no correlation between the proportion of Immigrants from Eastern Asia and percentage of households with 1 or more vehicles available in the United States with a correlation coefficient (R) of -0.022 and weighted average of 86.5%, a difference of 5.3%.
1 or more Vehicles in Household Correlation Summary
| Measurement | Bulgarian | Immigrants from Eastern Asia |
| Minimum | 86.9% | 31.4% |
| Maximum | 100.0% | 100.0% |
| Range | 13.1% | 68.6% |
| Mean | 95.5% | 87.4% |
| Median | 95.4% | 90.3% |
| Interquartile 25% (IQ1) | 94.1% | 85.6% |
| Interquartile 75% (IQ3) | 97.8% | 94.1% |
| Interquartile Range (IQR) | 3.7% | 8.6% |
| Standard Deviation (Sample) | 3.2% | 12.8% |
| Standard Deviation (Population) | 3.2% | 12.7% |
Similar Demographics by 1 or more Vehicles in Household
Demographics Similar to Bulgarians by 1 or more Vehicles in Household
In terms of 1 or more vehicles in household, the demographic groups most similar to Bulgarians are Immigrants from Central America (91.1%, a difference of 0.010%), Seminole (91.1%, a difference of 0.020%), Yugoslavian (91.1%, a difference of 0.030%), Asian (91.1%, a difference of 0.040%), and Immigrants from Bolivia (91.2%, a difference of 0.050%).
| Demographics | Rating | Rank | 1 or more Vehicles in Household |
| Immigrants | Cuba | 99.1 /100 | #94 | Exceptional 91.3% |
| Austrians | 99.0 /100 | #95 | Exceptional 91.3% |
| Potawatomi | 99.0 /100 | #96 | Exceptional 91.3% |
| Pakistanis | 99.0 /100 | #97 | Exceptional 91.3% |
| Slavs | 98.7 /100 | #98 | Exceptional 91.2% |
| Immigrants | Bolivia | 98.6 /100 | #99 | Exceptional 91.2% |
| Immigrants | Central America | 98.4 /100 | #100 | Exceptional 91.1% |
| Bulgarians | 98.4 /100 | #101 | Exceptional 91.1% |
| Seminole | 98.3 /100 | #102 | Exceptional 91.1% |
| Yugoslavians | 98.3 /100 | #103 | Exceptional 91.1% |
| Asians | 98.2 /100 | #104 | Exceptional 91.1% |
| Laotians | 98.0 /100 | #105 | Exceptional 91.0% |
| Zimbabweans | 97.7 /100 | #106 | Exceptional 91.0% |
| Maltese | 97.7 /100 | #107 | Exceptional 91.0% |
| Hispanics or Latinos | 97.6 /100 | #108 | Exceptional 91.0% |
Demographics Similar to Immigrants from Eastern Asia by 1 or more Vehicles in Household
In terms of 1 or more vehicles in household, the demographic groups most similar to Immigrants from Eastern Asia are Immigrants from Kazakhstan (86.6%, a difference of 0.030%), Immigrants from Malaysia (86.5%, a difference of 0.080%), Hopi (86.4%, a difference of 0.15%), Immigrants from Ireland (86.4%, a difference of 0.16%), and Immigrants from Australia (86.4%, a difference of 0.21%).
| Demographics | Rating | Rank | 1 or more Vehicles in Household |
| Immigrants | Albania | 0.1 /100 | #279 | Tragic 87.1% |
| Immigrants | Croatia | 0.0 /100 | #280 | Tragic 87.0% |
| Mongolians | 0.0 /100 | #281 | Tragic 87.0% |
| Colville | 0.0 /100 | #282 | Tragic 86.8% |
| Immigrants | Eastern Europe | 0.0 /100 | #283 | Tragic 86.7% |
| Central American Indians | 0.0 /100 | #284 | Tragic 86.7% |
| Immigrants | Kazakhstan | 0.0 /100 | #285 | Tragic 86.6% |
| Immigrants | Eastern Asia | 0.0 /100 | #286 | Tragic 86.5% |
| Immigrants | Malaysia | 0.0 /100 | #287 | Tragic 86.5% |
| Hopi | 0.0 /100 | #288 | Tragic 86.4% |
| Immigrants | Ireland | 0.0 /100 | #289 | Tragic 86.4% |
| Immigrants | Australia | 0.0 /100 | #290 | Tragic 86.4% |
| Pima | 0.0 /100 | #291 | Tragic 86.3% |
| Okinawans | 0.0 /100 | #292 | Tragic 86.1% |
| Indians (Asian) | 0.0 /100 | #293 | Tragic 86.0% |