Cape Verdean vs Immigrants from Germany 4 or more Vehicles in Household
COMPARE
Cape Verdean
Immigrants from Germany
4 or more Vehicles in Household
4 or more Vehicles in Household Comparison
Cape Verdeans
Immigrants from Germany
4.4%
4 OR MORE VEHICLES IN HOUSEHOLD
0.0/ 100
METRIC RATING
326th/ 347
METRIC RANK
6.8%
4 OR MORE VEHICLES IN HOUSEHOLD
94.7/ 100
METRIC RATING
121st/ 347
METRIC RANK
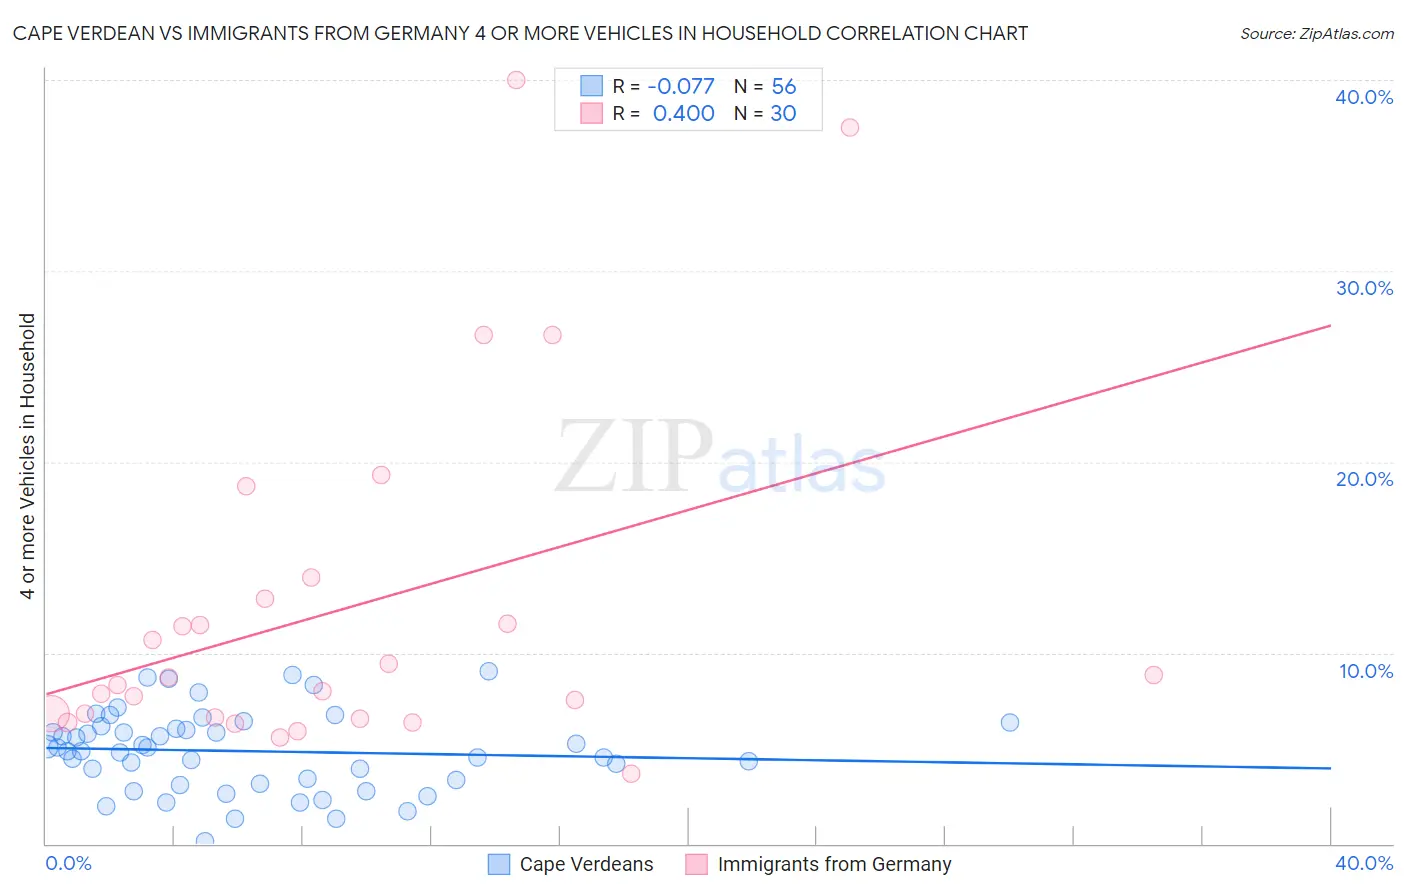
Cape Verdean vs Immigrants from Germany 4 or more Vehicles in Household Correlation Chart
The statistical analysis conducted on geographies consisting of 107,262,408 people shows a slight negative correlation between the proportion of Cape Verdeans and percentage of households with 4 or more vehicles available in the United States with a correlation coefficient (R) of -0.077 and weighted average of 4.4%. Similarly, the statistical analysis conducted on geographies consisting of 462,058,551 people shows a mild positive correlation between the proportion of Immigrants from Germany and percentage of households with 4 or more vehicles available in the United States with a correlation coefficient (R) of 0.400 and weighted average of 6.8%, a difference of 54.3%.
4 or more Vehicles in Household Correlation Summary
| Measurement | Cape Verdean | Immigrants from Germany |
| Minimum | 0.12% | 3.7% |
| Maximum | 9.0% | 40.0% |
| Range | 8.9% | 36.3% |
| Mean | 4.8% | 12.3% |
| Median | 4.9% | 8.5% |
| Interquartile 25% (IQ1) | 3.2% | 6.6% |
| Interquartile 75% (IQ3) | 6.1% | 12.8% |
| Interquartile Range (IQR) | 2.8% | 6.2% |
| Standard Deviation (Sample) | 2.1% | 9.2% |
| Standard Deviation (Population) | 2.1% | 9.0% |
Similar Demographics by 4 or more Vehicles in Household
Demographics Similar to Cape Verdeans by 4 or more Vehicles in Household
In terms of 4 or more vehicles in household, the demographic groups most similar to Cape Verdeans are Immigrants from Jamaica (4.4%, a difference of 0.32%), Soviet Union (4.4%, a difference of 0.64%), Immigrants from Caribbean (4.4%, a difference of 0.92%), Immigrants from Yemen (4.5%, a difference of 1.3%), and Ecuadorian (4.5%, a difference of 1.5%).
| Demographics | Rating | Rank | 4 or more Vehicles in Household |
| Haitians | 0.0 /100 | #319 | Tragic 4.6% |
| Immigrants | Haiti | 0.0 /100 | #320 | Tragic 4.5% |
| Ecuadorians | 0.0 /100 | #321 | Tragic 4.5% |
| Immigrants | Yemen | 0.0 /100 | #322 | Tragic 4.5% |
| Immigrants | Caribbean | 0.0 /100 | #323 | Tragic 4.4% |
| Soviet Union | 0.0 /100 | #324 | Tragic 4.4% |
| Immigrants | Jamaica | 0.0 /100 | #325 | Tragic 4.4% |
| Cape Verdeans | 0.0 /100 | #326 | Tragic 4.4% |
| Senegalese | 0.0 /100 | #327 | Tragic 4.3% |
| Trinidadians and Tobagonians | 0.0 /100 | #328 | Tragic 4.3% |
| Immigrants | Senegal | 0.0 /100 | #329 | Tragic 4.2% |
| Immigrants | Ecuador | 0.0 /100 | #330 | Tragic 4.2% |
| West Indians | 0.0 /100 | #331 | Tragic 4.2% |
| Immigrants | Dominica | 0.0 /100 | #332 | Tragic 4.2% |
| Immigrants | Albania | 0.0 /100 | #333 | Tragic 4.1% |
Demographics Similar to Immigrants from Germany by 4 or more Vehicles in Household
In terms of 4 or more vehicles in household, the demographic groups most similar to Immigrants from Germany are Immigrants from Nicaragua (6.8%, a difference of 0.0%), Comanche (6.8%, a difference of 0.060%), Immigrants (6.8%, a difference of 0.070%), Immigrants from Asia (6.8%, a difference of 0.16%), and Austrian (6.8%, a difference of 0.26%).
| Demographics | Rating | Rank | 4 or more Vehicles in Household |
| Bolivians | 96.3 /100 | #114 | Exceptional 6.8% |
| Tlingit-Haida | 96.2 /100 | #115 | Exceptional 6.8% |
| Immigrants | Guatemala | 95.8 /100 | #116 | Exceptional 6.8% |
| Burmese | 95.7 /100 | #117 | Exceptional 6.8% |
| French American Indians | 95.7 /100 | #118 | Exceptional 6.8% |
| Costa Ricans | 95.5 /100 | #119 | Exceptional 6.8% |
| Comanche | 94.8 /100 | #120 | Exceptional 6.8% |
| Immigrants | Germany | 94.7 /100 | #121 | Exceptional 6.8% |
| Immigrants | Nicaragua | 94.7 /100 | #122 | Exceptional 6.8% |
| Immigrants | Immigrants | 94.6 /100 | #123 | Exceptional 6.8% |
| Immigrants | Asia | 94.4 /100 | #124 | Exceptional 6.8% |
| Austrians | 94.1 /100 | #125 | Exceptional 6.8% |
| Belgians | 94.1 /100 | #126 | Exceptional 6.8% |
| Immigrants | Korea | 93.8 /100 | #127 | Exceptional 6.8% |
| Immigrants | Bolivia | 92.5 /100 | #128 | Exceptional 6.7% |