Bulgarian vs Immigrants from Germany College, Under 1 year
COMPARE
Bulgarian
Immigrants from Germany
College, Under 1 year
College, Under 1 year Comparison
Bulgarians
Immigrants from Germany
71.1%
COLLEGE, UNDER 1 YEAR
100.0/ 100
METRIC RATING
25th/ 347
METRIC RANK
66.5%
COLLEGE, UNDER 1 YEAR
82.0/ 100
METRIC RATING
144th/ 347
METRIC RANK
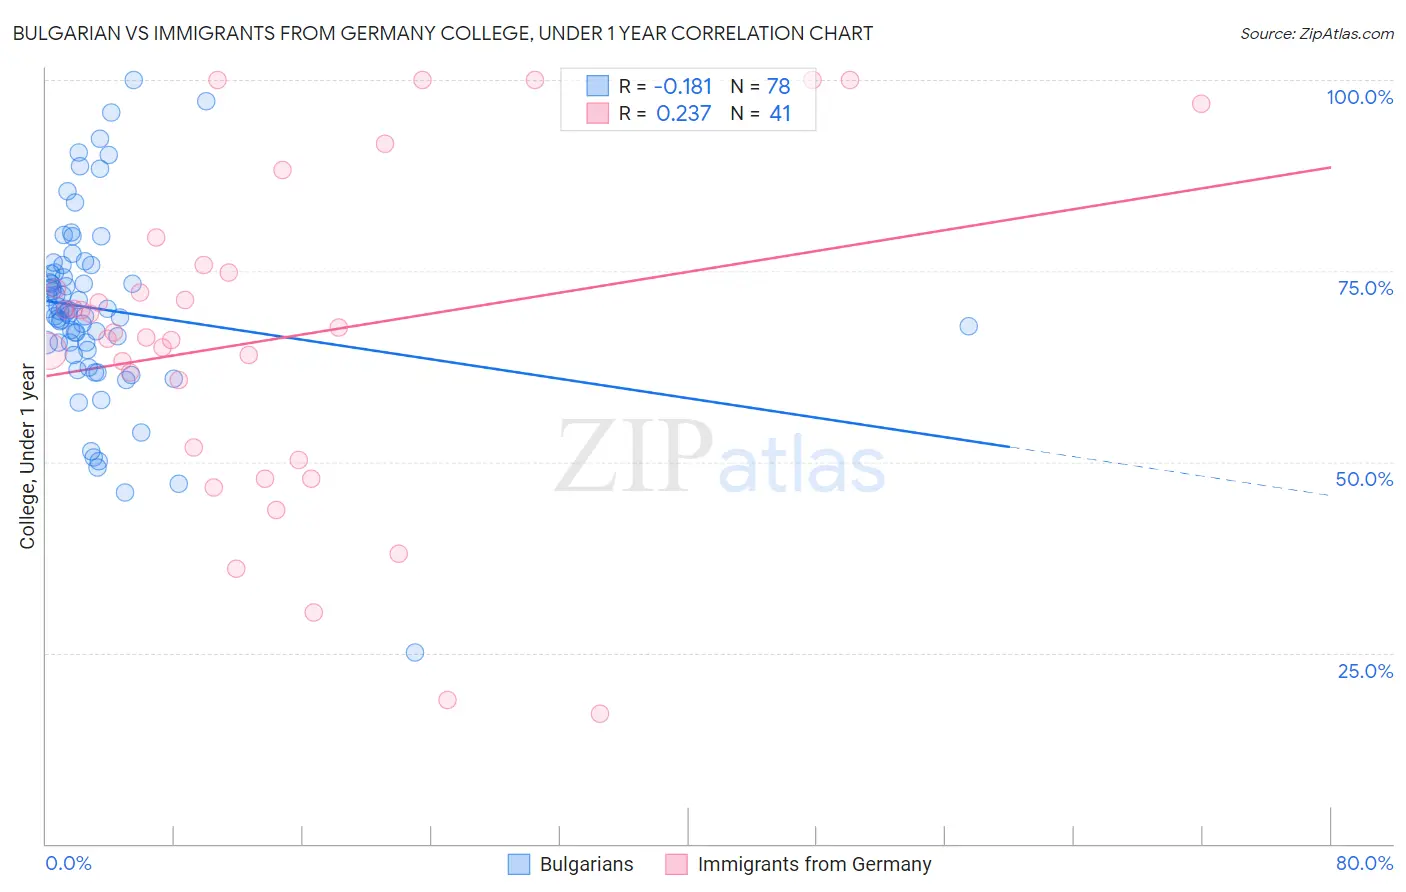
Bulgarian vs Immigrants from Germany College, Under 1 year Correlation Chart
The statistical analysis conducted on geographies consisting of 205,631,725 people shows a poor negative correlation between the proportion of Bulgarians and percentage of population with at least college, under 1 year education in the United States with a correlation coefficient (R) of -0.181 and weighted average of 71.1%. Similarly, the statistical analysis conducted on geographies consisting of 463,885,143 people shows a weak positive correlation between the proportion of Immigrants from Germany and percentage of population with at least college, under 1 year education in the United States with a correlation coefficient (R) of 0.237 and weighted average of 66.5%, a difference of 6.9%.
College, Under 1 year Correlation Summary
| Measurement | Bulgarian | Immigrants from Germany |
| Minimum | 25.0% | 17.0% |
| Maximum | 100.0% | 100.0% |
| Range | 75.0% | 83.0% |
| Mean | 70.0% | 66.2% |
| Median | 69.8% | 66.9% |
| Interquartile 25% (IQ1) | 65.6% | 51.1% |
| Interquartile 75% (IQ3) | 74.8% | 75.3% |
| Interquartile Range (IQR) | 9.3% | 24.2% |
| Standard Deviation (Sample) | 12.2% | 21.2% |
| Standard Deviation (Population) | 12.1% | 21.0% |
Similar Demographics by College, Under 1 year
Demographics Similar to Bulgarians by College, Under 1 year
In terms of college, under 1 year, the demographic groups most similar to Bulgarians are Soviet Union (71.1%, a difference of 0.020%), Immigrants from Northern Europe (71.1%, a difference of 0.030%), Immigrants from Denmark (71.0%, a difference of 0.12%), Immigrants from Ireland (71.0%, a difference of 0.13%), and Immigrants from Hong Kong (71.0%, a difference of 0.15%).
| Demographics | Rating | Rank | College, Under 1 year |
| Immigrants | Switzerland | 100.0 /100 | #18 | Exceptional 71.7% |
| Latvians | 100.0 /100 | #19 | Exceptional 71.6% |
| Immigrants | Korea | 100.0 /100 | #20 | Exceptional 71.6% |
| Immigrants | Belgium | 100.0 /100 | #21 | Exceptional 71.5% |
| Immigrants | Eastern Asia | 100.0 /100 | #22 | Exceptional 71.3% |
| Immigrants | Northern Europe | 100.0 /100 | #23 | Exceptional 71.1% |
| Soviet Union | 100.0 /100 | #24 | Exceptional 71.1% |
| Bulgarians | 100.0 /100 | #25 | Exceptional 71.1% |
| Immigrants | Denmark | 100.0 /100 | #26 | Exceptional 71.0% |
| Immigrants | Ireland | 100.0 /100 | #27 | Exceptional 71.0% |
| Immigrants | Hong Kong | 100.0 /100 | #28 | Exceptional 71.0% |
| Immigrants | France | 100.0 /100 | #29 | Exceptional 71.0% |
| Immigrants | China | 99.9 /100 | #30 | Exceptional 70.9% |
| Indians (Asian) | 99.9 /100 | #31 | Exceptional 70.8% |
| Turks | 99.9 /100 | #32 | Exceptional 70.7% |
Demographics Similar to Immigrants from Germany by College, Under 1 year
In terms of college, under 1 year, the demographic groups most similar to Immigrants from Germany are Immigrants from Kenya (66.5%, a difference of 0.010%), Kenyan (66.5%, a difference of 0.020%), Immigrants from Morocco (66.5%, a difference of 0.020%), Immigrants from Uganda (66.5%, a difference of 0.060%), and English (66.6%, a difference of 0.070%).
| Demographics | Rating | Rank | College, Under 1 year |
| Immigrants | Chile | 87.4 /100 | #137 | Excellent 66.8% |
| Immigrants | Italy | 86.9 /100 | #138 | Excellent 66.8% |
| Venezuelans | 85.9 /100 | #139 | Excellent 66.7% |
| Slavs | 85.9 /100 | #140 | Excellent 66.7% |
| Immigrants | Afghanistan | 85.1 /100 | #141 | Excellent 66.7% |
| English | 82.9 /100 | #142 | Excellent 66.6% |
| Immigrants | Uganda | 82.8 /100 | #143 | Excellent 66.5% |
| Immigrants | Germany | 82.0 /100 | #144 | Excellent 66.5% |
| Immigrants | Kenya | 81.8 /100 | #145 | Excellent 66.5% |
| Kenyans | 81.7 /100 | #146 | Excellent 66.5% |
| Immigrants | Morocco | 81.7 /100 | #147 | Excellent 66.5% |
| Taiwanese | 78.6 /100 | #148 | Good 66.4% |
| Immigrants | Venezuela | 77.9 /100 | #149 | Good 66.3% |
| Immigrants | Iraq | 77.1 /100 | #150 | Good 66.3% |
| Immigrants | Sudan | 76.0 /100 | #151 | Good 66.2% |