British West Indian vs Immigrants from Bulgaria 1 or more Vehicles in Household
COMPARE
British West Indian
Immigrants from Bulgaria
1 or more Vehicles in Household
1 or more Vehicles in Household Comparison
British West Indians
Immigrants from Bulgaria
70.4%
1 OR MORE VEHICLES IN HOUSEHOLD
0.0/ 100
METRIC RATING
343rd/ 347
METRIC RANK
89.6%
1 OR MORE VEHICLES IN HOUSEHOLD
40.7/ 100
METRIC RATING
184th/ 347
METRIC RANK
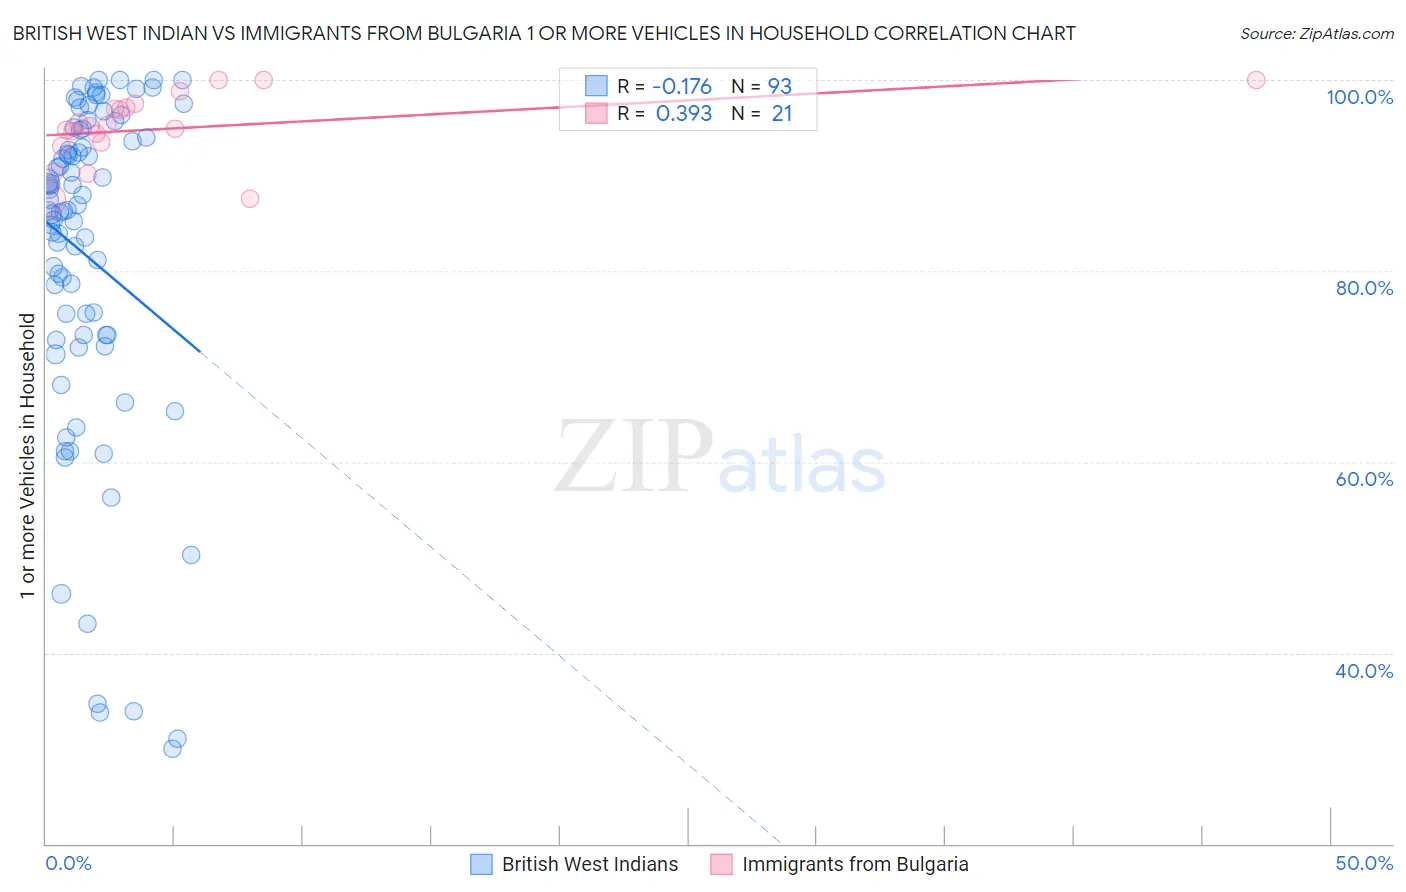
British West Indian vs Immigrants from Bulgaria 1 or more Vehicles in Household Correlation Chart
The statistical analysis conducted on geographies consisting of 152,639,821 people shows a poor negative correlation between the proportion of British West Indians and percentage of households with 1 or more vehicles available in the United States with a correlation coefficient (R) of -0.176 and weighted average of 70.4%. Similarly, the statistical analysis conducted on geographies consisting of 172,541,611 people shows a mild positive correlation between the proportion of Immigrants from Bulgaria and percentage of households with 1 or more vehicles available in the United States with a correlation coefficient (R) of 0.393 and weighted average of 89.6%, a difference of 27.3%.
1 or more Vehicles in Household Correlation Summary
| Measurement | British West Indian | Immigrants from Bulgaria |
| Minimum | 30.0% | 87.4% |
| Maximum | 100.0% | 100.0% |
| Range | 70.0% | 12.6% |
| Mean | 81.5% | 95.0% |
| Median | 86.4% | 95.1% |
| Interquartile 25% (IQ1) | 73.2% | 93.3% |
| Interquartile 75% (IQ3) | 94.3% | 97.4% |
| Interquartile Range (IQR) | 21.1% | 4.1% |
| Standard Deviation (Sample) | 17.6% | 3.7% |
| Standard Deviation (Population) | 17.5% | 3.6% |
Similar Demographics by 1 or more Vehicles in Household
Demographics Similar to British West Indians by 1 or more Vehicles in Household
In terms of 1 or more vehicles in household, the demographic groups most similar to British West Indians are Immigrants from Guyana (70.6%, a difference of 0.31%), Immigrants from Barbados (70.6%, a difference of 0.32%), Dominican (70.7%, a difference of 0.46%), Guyanese (70.8%, a difference of 0.64%), and Inupiat (71.5%, a difference of 1.7%).
| Demographics | Rating | Rank | 1 or more Vehicles in Household |
| Immigrants | Ecuador | 0.0 /100 | #333 | Tragic 76.2% |
| Immigrants | Bangladesh | 0.0 /100 | #334 | Tragic 74.3% |
| Barbadians | 0.0 /100 | #335 | Tragic 74.0% |
| Vietnamese | 0.0 /100 | #336 | Tragic 73.8% |
| Immigrants | Uzbekistan | 0.0 /100 | #337 | Tragic 73.4% |
| Inupiat | 0.0 /100 | #338 | Tragic 71.5% |
| Guyanese | 0.0 /100 | #339 | Tragic 70.8% |
| Dominicans | 0.0 /100 | #340 | Tragic 70.7% |
| Immigrants | Barbados | 0.0 /100 | #341 | Tragic 70.6% |
| Immigrants | Guyana | 0.0 /100 | #342 | Tragic 70.6% |
| British West Indians | 0.0 /100 | #343 | Tragic 70.4% |
| Immigrants | Dominican Republic | 0.0 /100 | #344 | Tragic 68.6% |
| Immigrants | St. Vincent and the Grenadines | 0.0 /100 | #345 | Tragic 64.7% |
| Immigrants | Grenada | 0.0 /100 | #346 | Tragic 62.7% |
| Yup'ik | 0.0 /100 | #347 | Tragic 58.4% |
Demographics Similar to Immigrants from Bulgaria by 1 or more Vehicles in Household
In terms of 1 or more vehicles in household, the demographic groups most similar to Immigrants from Bulgaria are Ethiopian (89.6%, a difference of 0.010%), Immigrants from Brazil (89.6%, a difference of 0.010%), Pueblo (89.6%, a difference of 0.010%), South American (89.5%, a difference of 0.020%), and Immigrants from Ethiopia (89.6%, a difference of 0.030%).
| Demographics | Rating | Rank | 1 or more Vehicles in Household |
| Hmong | 45.8 /100 | #177 | Average 89.6% |
| Immigrants | El Salvador | 44.1 /100 | #178 | Average 89.6% |
| German Russians | 44.0 /100 | #179 | Average 89.6% |
| Arabs | 43.3 /100 | #180 | Average 89.6% |
| Immigrants | Ethiopia | 42.5 /100 | #181 | Average 89.6% |
| Ukrainians | 42.4 /100 | #182 | Average 89.6% |
| Ethiopians | 41.2 /100 | #183 | Average 89.6% |
| Immigrants | Bulgaria | 40.7 /100 | #184 | Average 89.6% |
| Immigrants | Brazil | 40.1 /100 | #185 | Average 89.6% |
| Pueblo | 39.9 /100 | #186 | Fair 89.6% |
| South Americans | 39.6 /100 | #187 | Fair 89.5% |
| Immigrants | Nepal | 38.9 /100 | #188 | Fair 89.5% |
| Carpatho Rusyns | 37.8 /100 | #189 | Fair 89.5% |
| Shoshone | 37.5 /100 | #190 | Fair 89.5% |
| Immigrants | Poland | 37.1 /100 | #191 | Fair 89.5% |