Armenian vs Immigrants from Bulgaria 1 or more Vehicles in Household
COMPARE
Armenian
Immigrants from Bulgaria
1 or more Vehicles in Household
1 or more Vehicles in Household Comparison
Armenians
Immigrants from Bulgaria
90.7%
1 OR MORE VEHICLES IN HOUSEHOLD
94.5/ 100
METRIC RATING
114th/ 347
METRIC RANK
89.6%
1 OR MORE VEHICLES IN HOUSEHOLD
40.7/ 100
METRIC RATING
184th/ 347
METRIC RANK
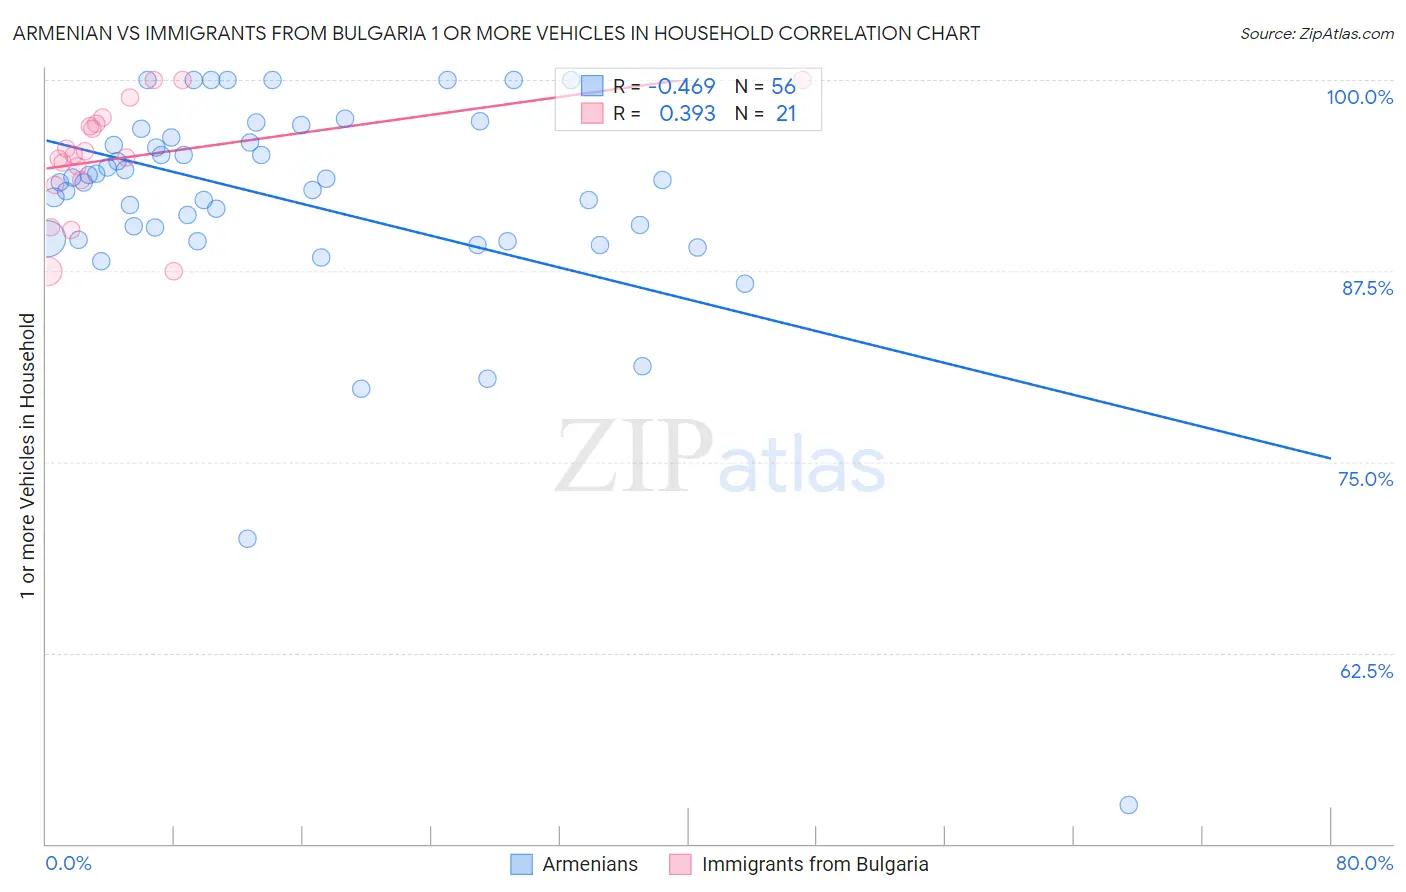
Armenian vs Immigrants from Bulgaria 1 or more Vehicles in Household Correlation Chart
The statistical analysis conducted on geographies consisting of 310,834,623 people shows a moderate negative correlation between the proportion of Armenians and percentage of households with 1 or more vehicles available in the United States with a correlation coefficient (R) of -0.469 and weighted average of 90.7%. Similarly, the statistical analysis conducted on geographies consisting of 172,541,611 people shows a mild positive correlation between the proportion of Immigrants from Bulgaria and percentage of households with 1 or more vehicles available in the United States with a correlation coefficient (R) of 0.393 and weighted average of 89.6%, a difference of 1.3%.
1 or more Vehicles in Household Correlation Summary
| Measurement | Armenian | Immigrants from Bulgaria |
| Minimum | 52.6% | 87.4% |
| Maximum | 100.0% | 100.0% |
| Range | 47.4% | 12.6% |
| Mean | 92.0% | 95.0% |
| Median | 93.4% | 95.1% |
| Interquartile 25% (IQ1) | 89.6% | 93.3% |
| Interquartile 75% (IQ3) | 96.1% | 97.4% |
| Interquartile Range (IQR) | 6.5% | 4.1% |
| Standard Deviation (Sample) | 7.8% | 3.7% |
| Standard Deviation (Population) | 7.7% | 3.6% |
Similar Demographics by 1 or more Vehicles in Household
Demographics Similar to Armenians by 1 or more Vehicles in Household
In terms of 1 or more vehicles in household, the demographic groups most similar to Armenians are Immigrants from Kuwait (90.7%, a difference of 0.020%), Serbian (90.7%, a difference of 0.020%), Chippewa (90.7%, a difference of 0.020%), Greek (90.6%, a difference of 0.070%), and Japanese (90.6%, a difference of 0.080%).
| Demographics | Rating | Rank | 1 or more Vehicles in Household |
| Maltese | 97.7 /100 | #107 | Exceptional 91.0% |
| Hispanics or Latinos | 97.6 /100 | #108 | Exceptional 91.0% |
| Delaware | 97.6 /100 | #109 | Exceptional 91.0% |
| Mexican American Indians | 97.4 /100 | #110 | Exceptional 91.0% |
| Navajo | 95.8 /100 | #111 | Exceptional 90.8% |
| Immigrants | Netherlands | 95.7 /100 | #112 | Exceptional 90.8% |
| Immigrants | Kuwait | 94.7 /100 | #113 | Exceptional 90.7% |
| Armenians | 94.5 /100 | #114 | Exceptional 90.7% |
| Serbians | 94.3 /100 | #115 | Exceptional 90.7% |
| Chippewa | 94.3 /100 | #116 | Exceptional 90.7% |
| Greeks | 93.5 /100 | #117 | Exceptional 90.6% |
| Japanese | 93.4 /100 | #118 | Exceptional 90.6% |
| Blackfeet | 92.6 /100 | #119 | Exceptional 90.6% |
| Immigrants | Thailand | 92.3 /100 | #120 | Exceptional 90.6% |
| Icelanders | 92.1 /100 | #121 | Exceptional 90.5% |
Demographics Similar to Immigrants from Bulgaria by 1 or more Vehicles in Household
In terms of 1 or more vehicles in household, the demographic groups most similar to Immigrants from Bulgaria are Ethiopian (89.6%, a difference of 0.010%), Immigrants from Brazil (89.6%, a difference of 0.010%), Pueblo (89.6%, a difference of 0.010%), South American (89.5%, a difference of 0.020%), and Immigrants from Ethiopia (89.6%, a difference of 0.030%).
| Demographics | Rating | Rank | 1 or more Vehicles in Household |
| Hmong | 45.8 /100 | #177 | Average 89.6% |
| Immigrants | El Salvador | 44.1 /100 | #178 | Average 89.6% |
| German Russians | 44.0 /100 | #179 | Average 89.6% |
| Arabs | 43.3 /100 | #180 | Average 89.6% |
| Immigrants | Ethiopia | 42.5 /100 | #181 | Average 89.6% |
| Ukrainians | 42.4 /100 | #182 | Average 89.6% |
| Ethiopians | 41.2 /100 | #183 | Average 89.6% |
| Immigrants | Bulgaria | 40.7 /100 | #184 | Average 89.6% |
| Immigrants | Brazil | 40.1 /100 | #185 | Average 89.6% |
| Pueblo | 39.9 /100 | #186 | Fair 89.6% |
| South Americans | 39.6 /100 | #187 | Fair 89.5% |
| Immigrants | Nepal | 38.9 /100 | #188 | Fair 89.5% |
| Carpatho Rusyns | 37.8 /100 | #189 | Fair 89.5% |
| Shoshone | 37.5 /100 | #190 | Fair 89.5% |
| Immigrants | Poland | 37.1 /100 | #191 | Fair 89.5% |