British West Indian vs Paiute 1 or more Vehicles in Household
COMPARE
British West Indian
Paiute
1 or more Vehicles in Household
1 or more Vehicles in Household Comparison
British West Indians
Paiute
70.4%
1 OR MORE VEHICLES IN HOUSEHOLD
0.0/ 100
METRIC RATING
343rd/ 347
METRIC RANK
88.6%
1 OR MORE VEHICLES IN HOUSEHOLD
4.6/ 100
METRIC RATING
235th/ 347
METRIC RANK
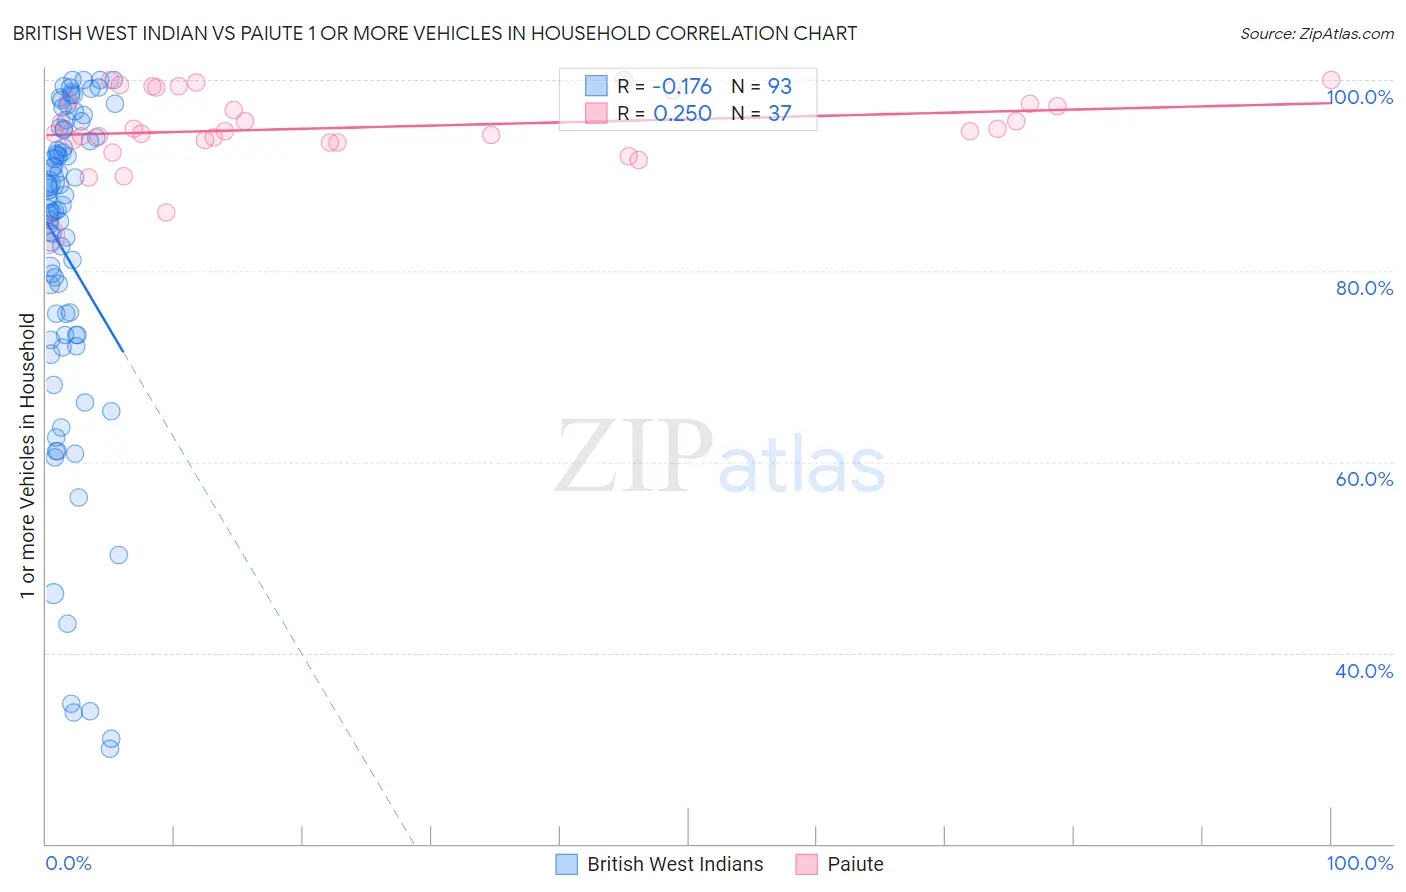
British West Indian vs Paiute 1 or more Vehicles in Household Correlation Chart
The statistical analysis conducted on geographies consisting of 152,639,821 people shows a poor negative correlation between the proportion of British West Indians and percentage of households with 1 or more vehicles available in the United States with a correlation coefficient (R) of -0.176 and weighted average of 70.4%. Similarly, the statistical analysis conducted on geographies consisting of 58,397,300 people shows a weak positive correlation between the proportion of Paiute and percentage of households with 1 or more vehicles available in the United States with a correlation coefficient (R) of 0.250 and weighted average of 88.6%, a difference of 26.0%.
1 or more Vehicles in Household Correlation Summary
| Measurement | British West Indian | Paiute |
| Minimum | 30.0% | 83.6% |
| Maximum | 100.0% | 100.0% |
| Range | 70.0% | 16.4% |
| Mean | 81.5% | 95.0% |
| Median | 86.4% | 94.6% |
| Interquartile 25% (IQ1) | 73.2% | 93.6% |
| Interquartile 75% (IQ3) | 94.3% | 98.4% |
| Interquartile Range (IQR) | 21.1% | 4.8% |
| Standard Deviation (Sample) | 17.6% | 3.8% |
| Standard Deviation (Population) | 17.5% | 3.7% |
Similar Demographics by 1 or more Vehicles in Household
Demographics Similar to British West Indians by 1 or more Vehicles in Household
In terms of 1 or more vehicles in household, the demographic groups most similar to British West Indians are Immigrants from Guyana (70.6%, a difference of 0.31%), Immigrants from Barbados (70.6%, a difference of 0.32%), Dominican (70.7%, a difference of 0.46%), Guyanese (70.8%, a difference of 0.64%), and Inupiat (71.5%, a difference of 1.7%).
| Demographics | Rating | Rank | 1 or more Vehicles in Household |
| Immigrants | Ecuador | 0.0 /100 | #333 | Tragic 76.2% |
| Immigrants | Bangladesh | 0.0 /100 | #334 | Tragic 74.3% |
| Barbadians | 0.0 /100 | #335 | Tragic 74.0% |
| Vietnamese | 0.0 /100 | #336 | Tragic 73.8% |
| Immigrants | Uzbekistan | 0.0 /100 | #337 | Tragic 73.4% |
| Inupiat | 0.0 /100 | #338 | Tragic 71.5% |
| Guyanese | 0.0 /100 | #339 | Tragic 70.8% |
| Dominicans | 0.0 /100 | #340 | Tragic 70.7% |
| Immigrants | Barbados | 0.0 /100 | #341 | Tragic 70.6% |
| Immigrants | Guyana | 0.0 /100 | #342 | Tragic 70.6% |
| British West Indians | 0.0 /100 | #343 | Tragic 70.4% |
| Immigrants | Dominican Republic | 0.0 /100 | #344 | Tragic 68.6% |
| Immigrants | St. Vincent and the Grenadines | 0.0 /100 | #345 | Tragic 64.7% |
| Immigrants | Grenada | 0.0 /100 | #346 | Tragic 62.7% |
| Yup'ik | 0.0 /100 | #347 | Tragic 58.4% |
Demographics Similar to Paiute by 1 or more Vehicles in Household
In terms of 1 or more vehicles in household, the demographic groups most similar to Paiute are Immigrants from Peru (88.6%, a difference of 0.0%), Houma (88.6%, a difference of 0.010%), Immigrants from Pakistan (88.6%, a difference of 0.010%), Immigrants from Turkey (88.6%, a difference of 0.020%), and Russian (88.7%, a difference of 0.030%).
| Demographics | Rating | Rank | 1 or more Vehicles in Household |
| Immigrants | Norway | 5.5 /100 | #228 | Tragic 88.7% |
| Immigrants | Romania | 5.4 /100 | #229 | Tragic 88.7% |
| Immigrants | Sierra Leone | 5.2 /100 | #230 | Tragic 88.7% |
| Russians | 5.0 /100 | #231 | Tragic 88.7% |
| Immigrants | Japan | 4.9 /100 | #232 | Tragic 88.7% |
| Houma | 4.8 /100 | #233 | Tragic 88.6% |
| Immigrants | Peru | 4.7 /100 | #234 | Tragic 88.6% |
| Paiute | 4.6 /100 | #235 | Tragic 88.6% |
| Immigrants | Pakistan | 4.5 /100 | #236 | Tragic 88.6% |
| Immigrants | Turkey | 4.4 /100 | #237 | Tragic 88.6% |
| Immigrants | Somalia | 4.2 /100 | #238 | Tragic 88.6% |
| Kiowa | 3.8 /100 | #239 | Tragic 88.6% |
| Eastern Europeans | 3.0 /100 | #240 | Tragic 88.5% |
| Taiwanese | 2.6 /100 | #241 | Tragic 88.4% |
| Turks | 2.5 /100 | #242 | Tragic 88.4% |