British West Indian vs Immigrants from Barbados 1 or more Vehicles in Household
COMPARE
British West Indian
Immigrants from Barbados
1 or more Vehicles in Household
1 or more Vehicles in Household Comparison
British West Indians
Immigrants from Barbados
70.4%
1 OR MORE VEHICLES IN HOUSEHOLD
0.0/ 100
METRIC RATING
343rd/ 347
METRIC RANK
70.6%
1 OR MORE VEHICLES IN HOUSEHOLD
0.0/ 100
METRIC RATING
341st/ 347
METRIC RANK
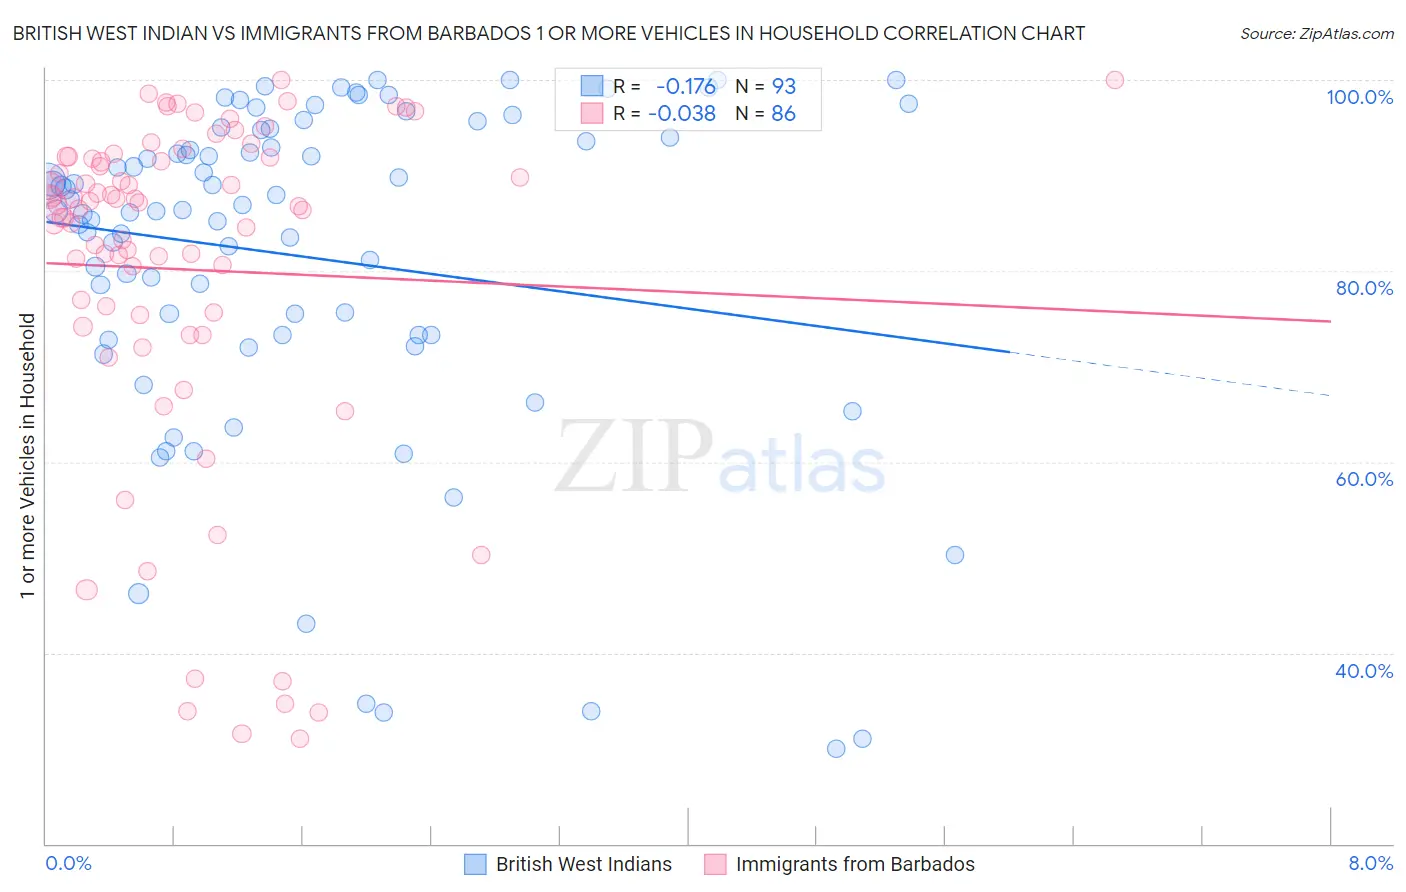
British West Indian vs Immigrants from Barbados 1 or more Vehicles in Household Correlation Chart
The statistical analysis conducted on geographies consisting of 152,639,821 people shows a poor negative correlation between the proportion of British West Indians and percentage of households with 1 or more vehicles available in the United States with a correlation coefficient (R) of -0.176 and weighted average of 70.4%. Similarly, the statistical analysis conducted on geographies consisting of 112,776,758 people shows no correlation between the proportion of Immigrants from Barbados and percentage of households with 1 or more vehicles available in the United States with a correlation coefficient (R) of -0.038 and weighted average of 70.6%, a difference of 0.32%.
1 or more Vehicles in Household Correlation Summary
| Measurement | British West Indian | Immigrants from Barbados |
| Minimum | 30.0% | 31.0% |
| Maximum | 100.0% | 100.0% |
| Range | 70.0% | 69.0% |
| Mean | 81.5% | 80.2% |
| Median | 86.4% | 86.9% |
| Interquartile 25% (IQ1) | 73.2% | 75.4% |
| Interquartile 75% (IQ3) | 94.3% | 91.9% |
| Interquartile Range (IQR) | 21.1% | 16.5% |
| Standard Deviation (Sample) | 17.6% | 18.1% |
| Standard Deviation (Population) | 17.5% | 18.0% |
Demographics Similar to British West Indians and Immigrants from Barbados by 1 or more Vehicles in Household
In terms of 1 or more vehicles in household, the demographic groups most similar to British West Indians are Immigrants from Guyana (70.6%, a difference of 0.31%), Dominican (70.7%, a difference of 0.46%), Guyanese (70.8%, a difference of 0.64%), Inupiat (71.5%, a difference of 1.7%), and Immigrants from Dominican Republic (68.6%, a difference of 2.5%). Similarly, the demographic groups most similar to Immigrants from Barbados are Immigrants from Guyana (70.6%, a difference of 0.010%), Dominican (70.7%, a difference of 0.13%), Guyanese (70.8%, a difference of 0.32%), Inupiat (71.5%, a difference of 1.3%), and Immigrants from Dominican Republic (68.6%, a difference of 2.8%).
| Demographics | Rating | Rank | 1 or more Vehicles in Household |
| Ecuadorians | 0.0 /100 | #328 | Tragic 77.9% |
| Immigrants | Dominica | 0.0 /100 | #329 | Tragic 77.8% |
| Immigrants | Trinidad and Tobago | 0.0 /100 | #330 | Tragic 76.8% |
| West Indians | 0.0 /100 | #331 | Tragic 76.4% |
| Trinidadians and Tobagonians | 0.0 /100 | #332 | Tragic 76.3% |
| Immigrants | Ecuador | 0.0 /100 | #333 | Tragic 76.2% |
| Immigrants | Bangladesh | 0.0 /100 | #334 | Tragic 74.3% |
| Barbadians | 0.0 /100 | #335 | Tragic 74.0% |
| Vietnamese | 0.0 /100 | #336 | Tragic 73.8% |
| Immigrants | Uzbekistan | 0.0 /100 | #337 | Tragic 73.4% |
| Inupiat | 0.0 /100 | #338 | Tragic 71.5% |
| Guyanese | 0.0 /100 | #339 | Tragic 70.8% |
| Dominicans | 0.0 /100 | #340 | Tragic 70.7% |
| Immigrants | Barbados | 0.0 /100 | #341 | Tragic 70.6% |
| Immigrants | Guyana | 0.0 /100 | #342 | Tragic 70.6% |
| British West Indians | 0.0 /100 | #343 | Tragic 70.4% |
| Immigrants | Dominican Republic | 0.0 /100 | #344 | Tragic 68.6% |
| Immigrants | St. Vincent and the Grenadines | 0.0 /100 | #345 | Tragic 64.7% |
| Immigrants | Grenada | 0.0 /100 | #346 | Tragic 62.7% |
| Yup'ik | 0.0 /100 | #347 | Tragic 58.4% |