Immigrants from Armenia vs Hispanic or Latino 3 or more Vehicles in Household
COMPARE
Immigrants from Armenia
Hispanic or Latino
3 or more Vehicles in Household
3 or more Vehicles in Household Comparison
Immigrants from Armenia
Hispanics or Latinos
18.6%
3 OR MORE VEHICLES IN HOUSEHOLD
8.6/ 100
METRIC RATING
219th/ 347
METRIC RANK
22.4%
3 OR MORE VEHICLES IN HOUSEHOLD
100.0/ 100
METRIC RATING
56th/ 347
METRIC RANK
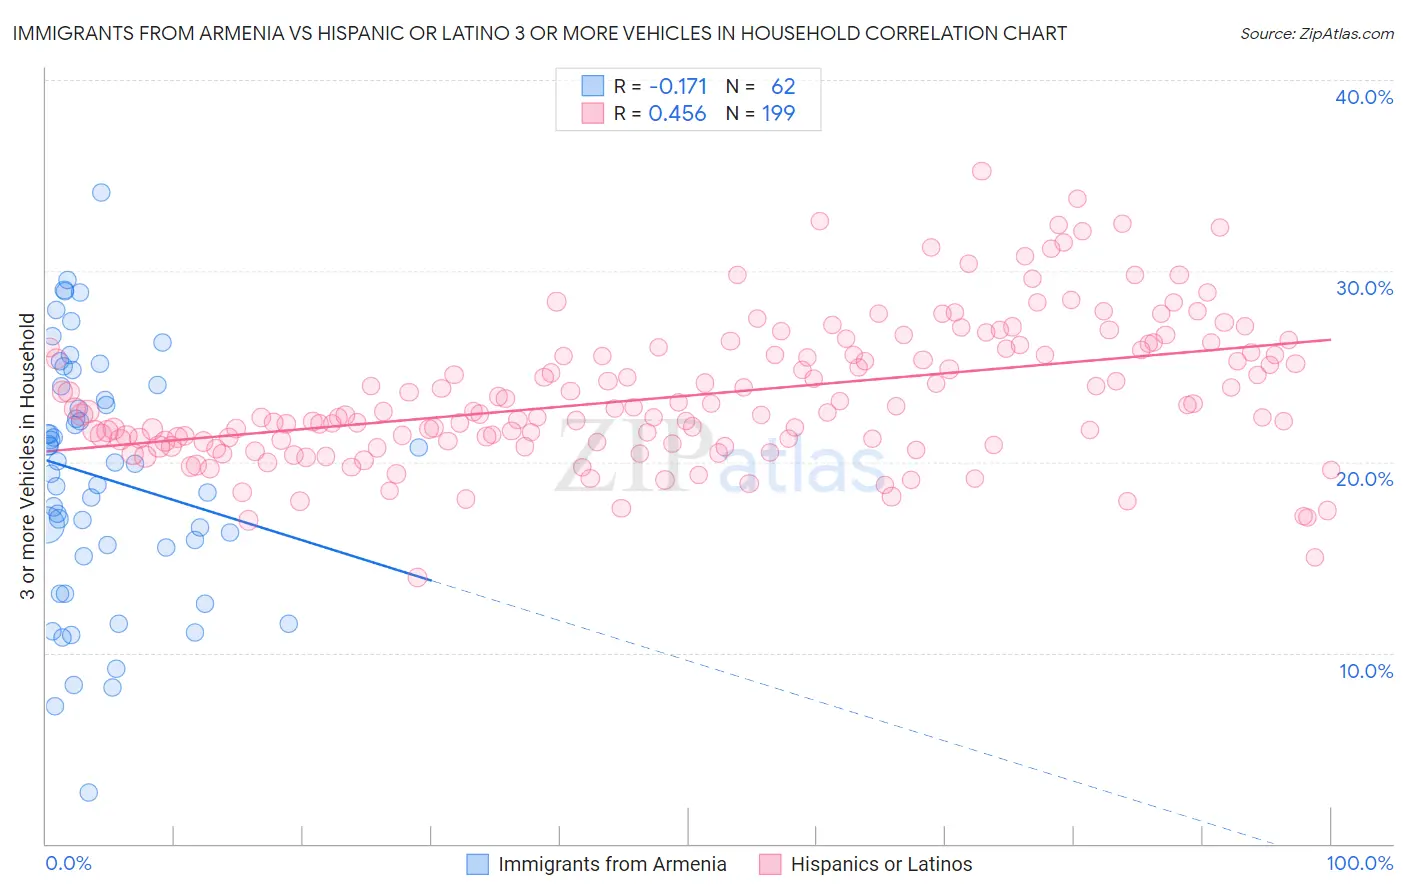
Immigrants from Armenia vs Hispanic or Latino 3 or more Vehicles in Household Correlation Chart
The statistical analysis conducted on geographies consisting of 97,705,679 people shows a poor negative correlation between the proportion of Immigrants from Armenia and percentage of households with 3 or more vehicles available in the United States with a correlation coefficient (R) of -0.171 and weighted average of 18.6%. Similarly, the statistical analysis conducted on geographies consisting of 563,449,459 people shows a moderate positive correlation between the proportion of Hispanics or Latinos and percentage of households with 3 or more vehicles available in the United States with a correlation coefficient (R) of 0.456 and weighted average of 22.4%, a difference of 20.1%.
3 or more Vehicles in Household Correlation Summary
| Measurement | Immigrants from Armenia | Hispanic or Latino |
| Minimum | 2.7% | 13.9% |
| Maximum | 34.1% | 35.2% |
| Range | 31.5% | 21.3% |
| Mean | 19.2% | 23.5% |
| Median | 19.9% | 22.6% |
| Interquartile 25% (IQ1) | 15.5% | 21.1% |
| Interquartile 75% (IQ3) | 23.9% | 25.8% |
| Interquartile Range (IQR) | 8.5% | 4.8% |
| Standard Deviation (Sample) | 6.5% | 3.7% |
| Standard Deviation (Population) | 6.4% | 3.7% |
Similar Demographics by 3 or more Vehicles in Household
Demographics Similar to Immigrants from Armenia by 3 or more Vehicles in Household
In terms of 3 or more vehicles in household, the demographic groups most similar to Immigrants from Armenia are Immigrants from Portugal (18.6%, a difference of 0.080%), Nigerian (18.6%, a difference of 0.20%), Immigrants from Poland (18.6%, a difference of 0.29%), Belizean (18.6%, a difference of 0.34%), and Immigrants from Italy (18.7%, a difference of 0.38%).
| Demographics | Rating | Rank | 3 or more Vehicles in Household |
| Panamanians | 11.6 /100 | #212 | Poor 18.8% |
| Immigrants | Cuba | 11.6 /100 | #213 | Poor 18.8% |
| Immigrants | Sierra Leone | 10.8 /100 | #214 | Poor 18.7% |
| Eastern Europeans | 10.6 /100 | #215 | Poor 18.7% |
| Immigrants | Nigeria | 10.3 /100 | #216 | Poor 18.7% |
| Immigrants | Italy | 10.2 /100 | #217 | Poor 18.7% |
| Immigrants | Portugal | 8.9 /100 | #218 | Tragic 18.6% |
| Immigrants | Armenia | 8.6 /100 | #219 | Tragic 18.6% |
| Nigerians | 7.9 /100 | #220 | Tragic 18.6% |
| Immigrants | Poland | 7.5 /100 | #221 | Tragic 18.6% |
| Belizeans | 7.3 /100 | #222 | Tragic 18.6% |
| Immigrants | Czechoslovakia | 5.9 /100 | #223 | Tragic 18.5% |
| Immigrants | Argentina | 5.6 /100 | #224 | Tragic 18.5% |
| Immigrants | Lithuania | 5.6 /100 | #225 | Tragic 18.5% |
| Immigrants | Hungary | 5.5 /100 | #226 | Tragic 18.5% |
Demographics Similar to Hispanics or Latinos by 3 or more Vehicles in Household
In terms of 3 or more vehicles in household, the demographic groups most similar to Hispanics or Latinos are Immigrants from Laos (22.4%, a difference of 0.030%), Pennsylvania German (22.3%, a difference of 0.16%), Spaniard (22.3%, a difference of 0.29%), Navajo (22.3%, a difference of 0.35%), and Crow (22.5%, a difference of 0.40%).
| Demographics | Rating | Rank | 3 or more Vehicles in Household |
| Scotch-Irish | 100.0 /100 | #49 | Exceptional 22.6% |
| Sioux | 100.0 /100 | #50 | Exceptional 22.6% |
| Whites/Caucasians | 100.0 /100 | #51 | Exceptional 22.6% |
| Welsh | 100.0 /100 | #52 | Exceptional 22.6% |
| Czechs | 100.0 /100 | #53 | Exceptional 22.5% |
| Crow | 100.0 /100 | #54 | Exceptional 22.5% |
| Immigrants | Laos | 100.0 /100 | #55 | Exceptional 22.4% |
| Hispanics or Latinos | 100.0 /100 | #56 | Exceptional 22.4% |
| Pennsylvania Germans | 100.0 /100 | #57 | Exceptional 22.3% |
| Spaniards | 100.0 /100 | #58 | Exceptional 22.3% |
| Navajo | 100.0 /100 | #59 | Exceptional 22.3% |
| Finns | 99.9 /100 | #60 | Exceptional 22.3% |
| Bhutanese | 99.9 /100 | #61 | Exceptional 22.2% |
| Fijians | 99.9 /100 | #62 | Exceptional 22.2% |
| Chickasaw | 99.9 /100 | #63 | Exceptional 22.2% |