Brazilian vs Kiowa 4 or more Vehicles in Household
COMPARE
Brazilian
Kiowa
4 or more Vehicles in Household
4 or more Vehicles in Household Comparison
Brazilians
Kiowa
5.4%
4 OR MORE VEHICLES IN HOUSEHOLD
0.3/ 100
METRIC RATING
284th/ 347
METRIC RANK
6.2%
4 OR MORE VEHICLES IN HOUSEHOLD
34.7/ 100
METRIC RATING
188th/ 347
METRIC RANK
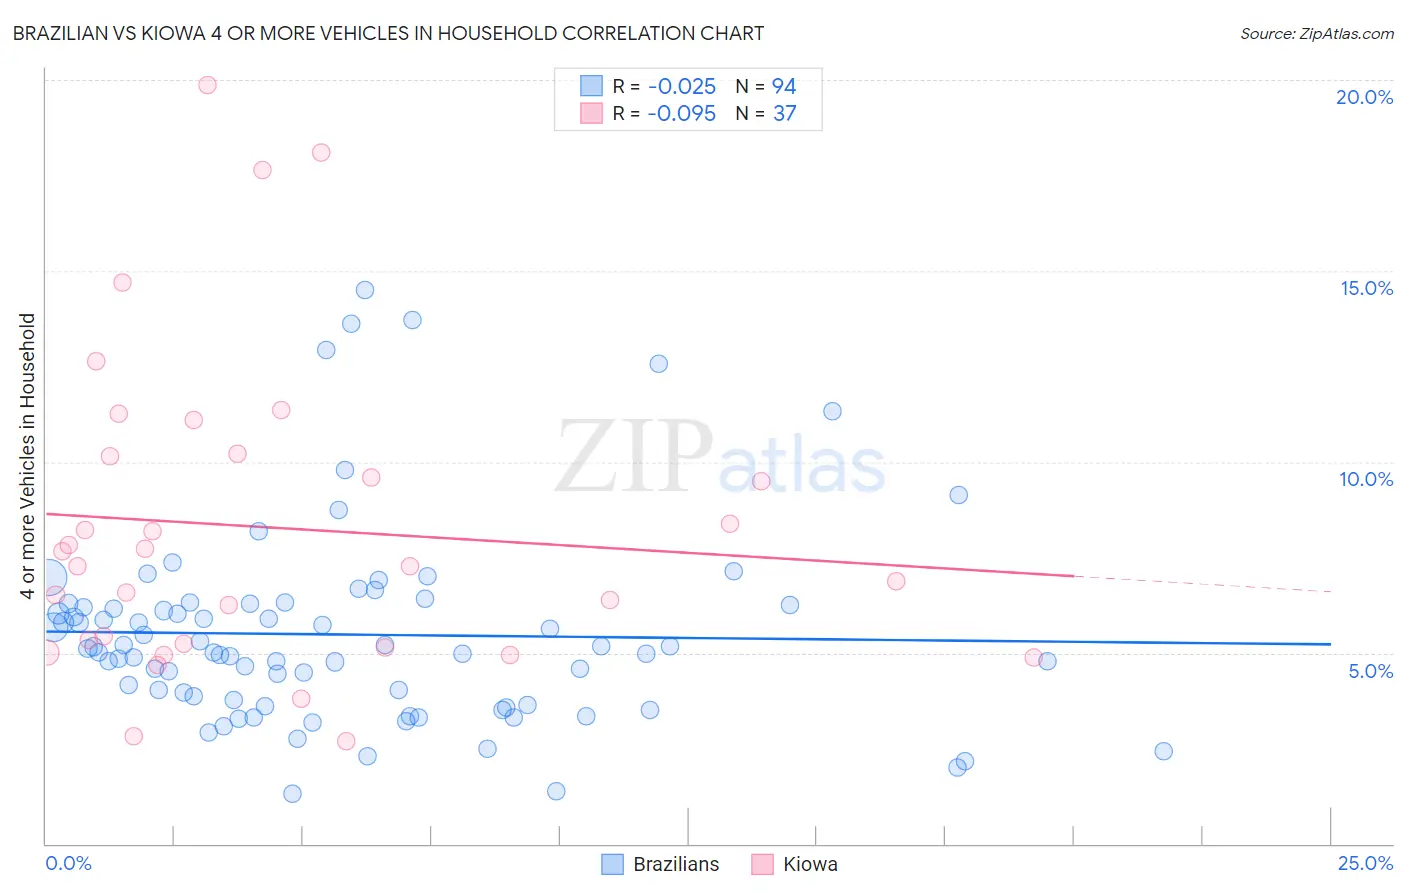
Brazilian vs Kiowa 4 or more Vehicles in Household Correlation Chart
The statistical analysis conducted on geographies consisting of 322,327,740 people shows no correlation between the proportion of Brazilians and percentage of households with 4 or more vehicles available in the United States with a correlation coefficient (R) of -0.025 and weighted average of 5.4%. Similarly, the statistical analysis conducted on geographies consisting of 56,082,422 people shows a slight negative correlation between the proportion of Kiowa and percentage of households with 4 or more vehicles available in the United States with a correlation coefficient (R) of -0.095 and weighted average of 6.2%, a difference of 15.8%.
4 or more Vehicles in Household Correlation Summary
| Measurement | Brazilian | Kiowa |
| Minimum | 1.3% | 2.7% |
| Maximum | 14.5% | 19.9% |
| Range | 13.2% | 17.2% |
| Mean | 5.5% | 8.3% |
| Median | 5.1% | 7.3% |
| Interquartile 25% (IQ1) | 3.7% | 5.2% |
| Interquartile 75% (IQ3) | 6.3% | 10.2% |
| Interquartile Range (IQR) | 2.5% | 5.0% |
| Standard Deviation (Sample) | 2.6% | 4.1% |
| Standard Deviation (Population) | 2.6% | 4.1% |
Similar Demographics by 4 or more Vehicles in Household
Demographics Similar to Brazilians by 4 or more Vehicles in Household
In terms of 4 or more vehicles in household, the demographic groups most similar to Brazilians are Immigrants from Ireland (5.4%, a difference of 0.29%), Immigrants from Liberia (5.4%, a difference of 0.34%), Immigrants from Spain (5.4%, a difference of 0.37%), Immigrants from Colombia (5.4%, a difference of 0.38%), and Immigrants from Croatia (5.4%, a difference of 0.47%).
| Demographics | Rating | Rank | 4 or more Vehicles in Household |
| Immigrants | Bulgaria | 0.5 /100 | #277 | Tragic 5.5% |
| Immigrants | Eastern Europe | 0.4 /100 | #278 | Tragic 5.4% |
| Immigrants | Uruguay | 0.3 /100 | #279 | Tragic 5.4% |
| Alsatians | 0.3 /100 | #280 | Tragic 5.4% |
| Immigrants | Western Africa | 0.3 /100 | #281 | Tragic 5.4% |
| Immigrants | Spain | 0.3 /100 | #282 | Tragic 5.4% |
| Immigrants | Ireland | 0.3 /100 | #283 | Tragic 5.4% |
| Brazilians | 0.3 /100 | #284 | Tragic 5.4% |
| Immigrants | Liberia | 0.2 /100 | #285 | Tragic 5.4% |
| Immigrants | Colombia | 0.2 /100 | #286 | Tragic 5.4% |
| Immigrants | Croatia | 0.2 /100 | #287 | Tragic 5.4% |
| Venezuelans | 0.2 /100 | #288 | Tragic 5.3% |
| Immigrants | Bosnia and Herzegovina | 0.2 /100 | #289 | Tragic 5.3% |
| Immigrants | Russia | 0.2 /100 | #290 | Tragic 5.3% |
| Immigrants | Bahamas | 0.1 /100 | #291 | Tragic 5.3% |
Demographics Similar to Kiowa by 4 or more Vehicles in Household
In terms of 4 or more vehicles in household, the demographic groups most similar to Kiowa are Immigrants from South Africa (6.2%, a difference of 0.070%), Immigrants from Eastern Asia (6.2%, a difference of 0.17%), Immigrants from Northern Europe (6.2%, a difference of 0.23%), Thai (6.2%, a difference of 0.25%), and Iraqi (6.2%, a difference of 0.29%).
| Demographics | Rating | Rank | 4 or more Vehicles in Household |
| Yugoslavians | 41.1 /100 | #181 | Average 6.3% |
| South American Indians | 40.7 /100 | #182 | Average 6.3% |
| Immigrants | Burma/Myanmar | 37.5 /100 | #183 | Fair 6.2% |
| Iraqis | 37.3 /100 | #184 | Fair 6.2% |
| Thais | 36.9 /100 | #185 | Fair 6.2% |
| Immigrants | Northern Europe | 36.8 /100 | #186 | Fair 6.2% |
| Immigrants | South Africa | 35.4 /100 | #187 | Fair 6.2% |
| Kiowa | 34.7 /100 | #188 | Fair 6.2% |
| Immigrants | Eastern Asia | 33.3 /100 | #189 | Fair 6.2% |
| South Africans | 32.2 /100 | #190 | Fair 6.2% |
| Inupiat | 30.7 /100 | #191 | Fair 6.2% |
| Romanians | 30.7 /100 | #192 | Fair 6.2% |
| Immigrants | Kuwait | 28.0 /100 | #193 | Fair 6.2% |
| Immigrants | Sweden | 27.0 /100 | #194 | Fair 6.2% |
| Argentineans | 27.0 /100 | #195 | Fair 6.2% |