Immigrants from China vs Immigrants from Dominica No Vehicles in Household
COMPARE
Immigrants from China
Immigrants from Dominica
No Vehicles in Household
No Vehicles in Household Comparison
Immigrants from China
Immigrants from Dominica
15.2%
NO VEHICLES IN HOUSEHOLD
0.0/ 100
METRIC RATING
305th/ 347
METRIC RANK
22.2%
NO VEHICLES IN HOUSEHOLD
0.0/ 100
METRIC RATING
328th/ 347
METRIC RANK
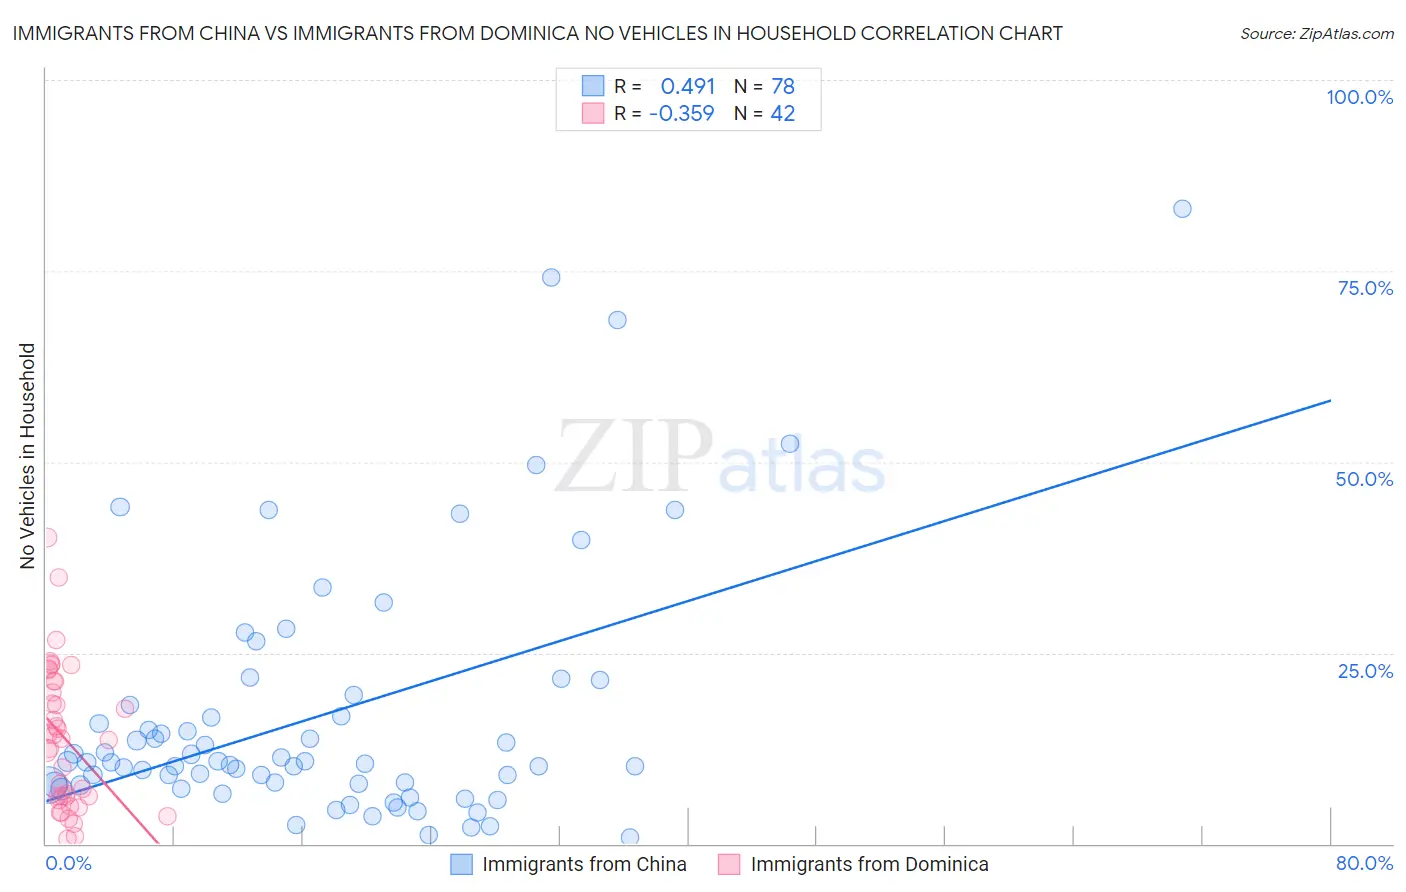
Immigrants from China vs Immigrants from Dominica No Vehicles in Household Correlation Chart
The statistical analysis conducted on geographies consisting of 455,244,510 people shows a moderate positive correlation between the proportion of Immigrants from China and percentage of households with no vehicle available in the United States with a correlation coefficient (R) of 0.491 and weighted average of 15.2%. Similarly, the statistical analysis conducted on geographies consisting of 83,752,468 people shows a mild negative correlation between the proportion of Immigrants from Dominica and percentage of households with no vehicle available in the United States with a correlation coefficient (R) of -0.359 and weighted average of 22.2%, a difference of 46.7%.
No Vehicles in Household Correlation Summary
| Measurement | Immigrants from China | Immigrants from Dominica |
| Minimum | 0.81% | 0.64% |
| Maximum | 83.2% | 40.0% |
| Range | 82.4% | 39.4% |
| Mean | 16.9% | 13.7% |
| Median | 10.7% | 13.7% |
| Interquartile 25% (IQ1) | 7.7% | 6.2% |
| Interquartile 75% (IQ3) | 18.2% | 21.2% |
| Interquartile Range (IQR) | 10.5% | 15.1% |
| Standard Deviation (Sample) | 16.7% | 9.3% |
| Standard Deviation (Population) | 16.6% | 9.2% |
Similar Demographics by No Vehicles in Household
Demographics Similar to Immigrants from China by No Vehicles in Household
In terms of no vehicles in household, the demographic groups most similar to Immigrants from China are Immigrants from Russia (15.1%, a difference of 0.38%), Immigrants from Western Africa (15.0%, a difference of 1.0%), Immigrants from Belize (15.4%, a difference of 1.3%), Immigrants from Haiti (15.4%, a difference of 1.5%), and U.S. Virgin Islander (15.4%, a difference of 1.5%).
| Demographics | Rating | Rank | No Vehicles in Household |
| Moroccans | 0.0 /100 | #298 | Tragic 14.7% |
| Immigrants | Greece | 0.0 /100 | #299 | Tragic 14.7% |
| Yuman | 0.0 /100 | #300 | Tragic 14.9% |
| Immigrants | Ukraine | 0.0 /100 | #301 | Tragic 14.9% |
| Haitians | 0.0 /100 | #302 | Tragic 14.9% |
| Immigrants | Western Africa | 0.0 /100 | #303 | Tragic 15.0% |
| Immigrants | Russia | 0.0 /100 | #304 | Tragic 15.1% |
| Immigrants | China | 0.0 /100 | #305 | Tragic 15.2% |
| Immigrants | Belize | 0.0 /100 | #306 | Tragic 15.4% |
| Immigrants | Haiti | 0.0 /100 | #307 | Tragic 15.4% |
| U.S. Virgin Islanders | 0.0 /100 | #308 | Tragic 15.4% |
| Puerto Ricans | 0.0 /100 | #309 | Tragic 15.5% |
| Cape Verdeans | 0.0 /100 | #310 | Tragic 15.6% |
| Immigrants | Israel | 0.0 /100 | #311 | Tragic 15.6% |
| Alaskan Athabascans | 0.0 /100 | #312 | Tragic 15.6% |
Demographics Similar to Immigrants from Dominica by No Vehicles in Household
In terms of no vehicles in household, the demographic groups most similar to Immigrants from Dominica are Ecuadorian (22.8%, a difference of 2.3%), Immigrants from Senegal (21.1%, a difference of 5.1%), West Indian (23.7%, a difference of 6.6%), Trinidadian and Tobagonian (23.7%, a difference of 6.8%), and Immigrants from Ecuador (23.8%, a difference of 7.2%).
| Demographics | Rating | Rank | No Vehicles in Household |
| Jamaicans | 0.0 /100 | #321 | Tragic 17.9% |
| Immigrants | Cabo Verde | 0.0 /100 | #322 | Tragic 18.4% |
| Immigrants | Yemen | 0.0 /100 | #323 | Tragic 19.5% |
| Immigrants | Caribbean | 0.0 /100 | #324 | Tragic 19.6% |
| Senegalese | 0.0 /100 | #325 | Tragic 19.8% |
| Immigrants | West Indies | 0.0 /100 | #326 | Tragic 20.5% |
| Immigrants | Senegal | 0.0 /100 | #327 | Tragic 21.1% |
| Immigrants | Dominica | 0.0 /100 | #328 | Tragic 22.2% |
| Ecuadorians | 0.0 /100 | #329 | Tragic 22.8% |
| West Indians | 0.0 /100 | #330 | Tragic 23.7% |
| Trinidadians and Tobagonians | 0.0 /100 | #331 | Tragic 23.7% |
| Immigrants | Ecuador | 0.0 /100 | #332 | Tragic 23.8% |
| Immigrants | Trinidad and Tobago | 0.0 /100 | #333 | Tragic 24.6% |
| Immigrants | Bangladesh | 0.0 /100 | #334 | Tragic 25.8% |
| Barbadians | 0.0 /100 | #335 | Tragic 26.1% |