Lumbee vs Immigrants from Dominica No Vehicles in Household
COMPARE
Lumbee
Immigrants from Dominica
No Vehicles in Household
No Vehicles in Household Comparison
Lumbee
Immigrants from Dominica
10.3%
NO VEHICLES IN HOUSEHOLD
54.7/ 100
METRIC RATING
169th/ 347
METRIC RANK
22.2%
NO VEHICLES IN HOUSEHOLD
0.0/ 100
METRIC RATING
328th/ 347
METRIC RANK
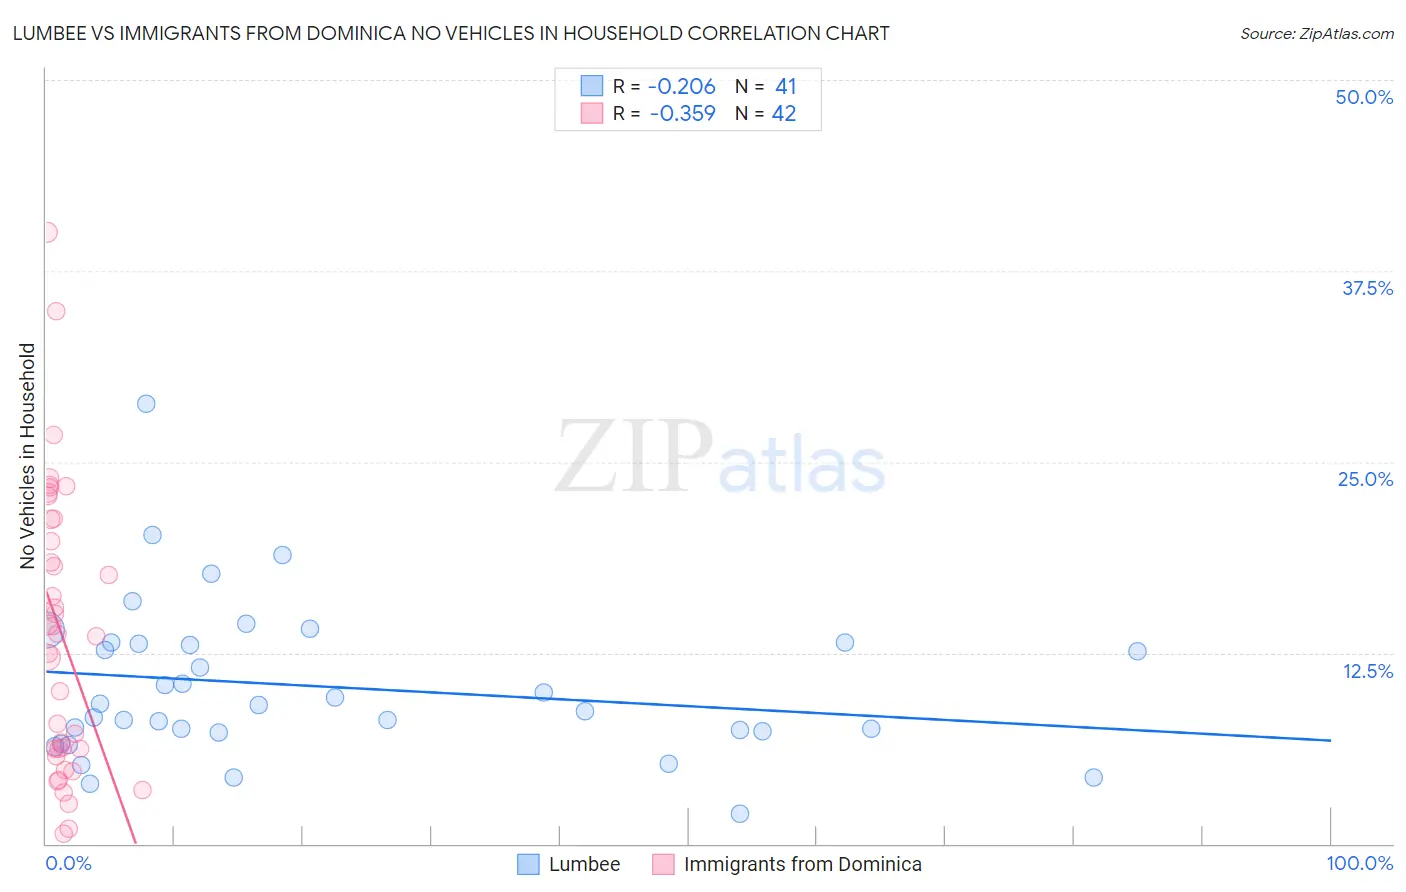
Lumbee vs Immigrants from Dominica No Vehicles in Household Correlation Chart
The statistical analysis conducted on geographies consisting of 92,166,207 people shows a weak negative correlation between the proportion of Lumbee and percentage of households with no vehicle available in the United States with a correlation coefficient (R) of -0.206 and weighted average of 10.3%. Similarly, the statistical analysis conducted on geographies consisting of 83,752,468 people shows a mild negative correlation between the proportion of Immigrants from Dominica and percentage of households with no vehicle available in the United States with a correlation coefficient (R) of -0.359 and weighted average of 22.2%, a difference of 115.1%.
No Vehicles in Household Correlation Summary
| Measurement | Lumbee | Immigrants from Dominica |
| Minimum | 2.0% | 0.64% |
| Maximum | 28.8% | 40.0% |
| Range | 26.8% | 39.4% |
| Mean | 10.3% | 13.7% |
| Median | 9.1% | 13.7% |
| Interquartile 25% (IQ1) | 7.3% | 6.2% |
| Interquartile 75% (IQ3) | 13.1% | 21.2% |
| Interquartile Range (IQR) | 5.8% | 15.1% |
| Standard Deviation (Sample) | 5.1% | 9.3% |
| Standard Deviation (Population) | 5.0% | 9.2% |
Similar Demographics by No Vehicles in Household
Demographics Similar to Lumbee by No Vehicles in Household
In terms of no vehicles in household, the demographic groups most similar to Lumbee are Immigrants from Latin America (10.4%, a difference of 0.21%), Indonesian (10.3%, a difference of 0.27%), Hmong (10.4%, a difference of 0.28%), Brazilian (10.4%, a difference of 0.42%), and Immigrants from Saudi Arabia (10.3%, a difference of 0.56%).
| Demographics | Rating | Rank | No Vehicles in Household |
| Immigrants | Austria | 64.4 /100 | #162 | Good 10.2% |
| Immigrants | Cambodia | 63.7 /100 | #163 | Good 10.2% |
| South Africans | 61.1 /100 | #164 | Good 10.2% |
| Comanche | 60.8 /100 | #165 | Good 10.2% |
| Immigrants | Costa Rica | 60.5 /100 | #166 | Good 10.3% |
| Immigrants | Saudi Arabia | 58.8 /100 | #167 | Average 10.3% |
| Indonesians | 56.7 /100 | #168 | Average 10.3% |
| Lumbee | 54.7 /100 | #169 | Average 10.3% |
| Immigrants | Latin America | 53.2 /100 | #170 | Average 10.4% |
| Hmong | 52.7 /100 | #171 | Average 10.4% |
| Brazilians | 51.7 /100 | #172 | Average 10.4% |
| Filipinos | 50.1 /100 | #173 | Average 10.4% |
| Immigrants | Sudan | 50.0 /100 | #174 | Average 10.4% |
| Immigrants | Burma/Myanmar | 49.1 /100 | #175 | Average 10.4% |
| French American Indians | 49.1 /100 | #176 | Average 10.4% |
Demographics Similar to Immigrants from Dominica by No Vehicles in Household
In terms of no vehicles in household, the demographic groups most similar to Immigrants from Dominica are Ecuadorian (22.8%, a difference of 2.3%), Immigrants from Senegal (21.1%, a difference of 5.1%), West Indian (23.7%, a difference of 6.6%), Trinidadian and Tobagonian (23.7%, a difference of 6.8%), and Immigrants from Ecuador (23.8%, a difference of 7.2%).
| Demographics | Rating | Rank | No Vehicles in Household |
| Jamaicans | 0.0 /100 | #321 | Tragic 17.9% |
| Immigrants | Cabo Verde | 0.0 /100 | #322 | Tragic 18.4% |
| Immigrants | Yemen | 0.0 /100 | #323 | Tragic 19.5% |
| Immigrants | Caribbean | 0.0 /100 | #324 | Tragic 19.6% |
| Senegalese | 0.0 /100 | #325 | Tragic 19.8% |
| Immigrants | West Indies | 0.0 /100 | #326 | Tragic 20.5% |
| Immigrants | Senegal | 0.0 /100 | #327 | Tragic 21.1% |
| Immigrants | Dominica | 0.0 /100 | #328 | Tragic 22.2% |
| Ecuadorians | 0.0 /100 | #329 | Tragic 22.8% |
| West Indians | 0.0 /100 | #330 | Tragic 23.7% |
| Trinidadians and Tobagonians | 0.0 /100 | #331 | Tragic 23.7% |
| Immigrants | Ecuador | 0.0 /100 | #332 | Tragic 23.8% |
| Immigrants | Trinidad and Tobago | 0.0 /100 | #333 | Tragic 24.6% |
| Immigrants | Bangladesh | 0.0 /100 | #334 | Tragic 25.8% |
| Barbadians | 0.0 /100 | #335 | Tragic 26.1% |