Blackfeet vs Cypriot In Labor Force | Age 25-29
COMPARE
Blackfeet
Cypriot
In Labor Force | Age 25-29
In Labor Force | Age 25-29 Comparison
Blackfeet
Cypriots
82.6%
IN LABOR FORCE | AGE 25-29
0.0/ 100
METRIC RATING
306th/ 347
METRIC RANK
85.8%
IN LABOR FORCE | AGE 25-29
99.9/ 100
METRIC RATING
35th/ 347
METRIC RANK
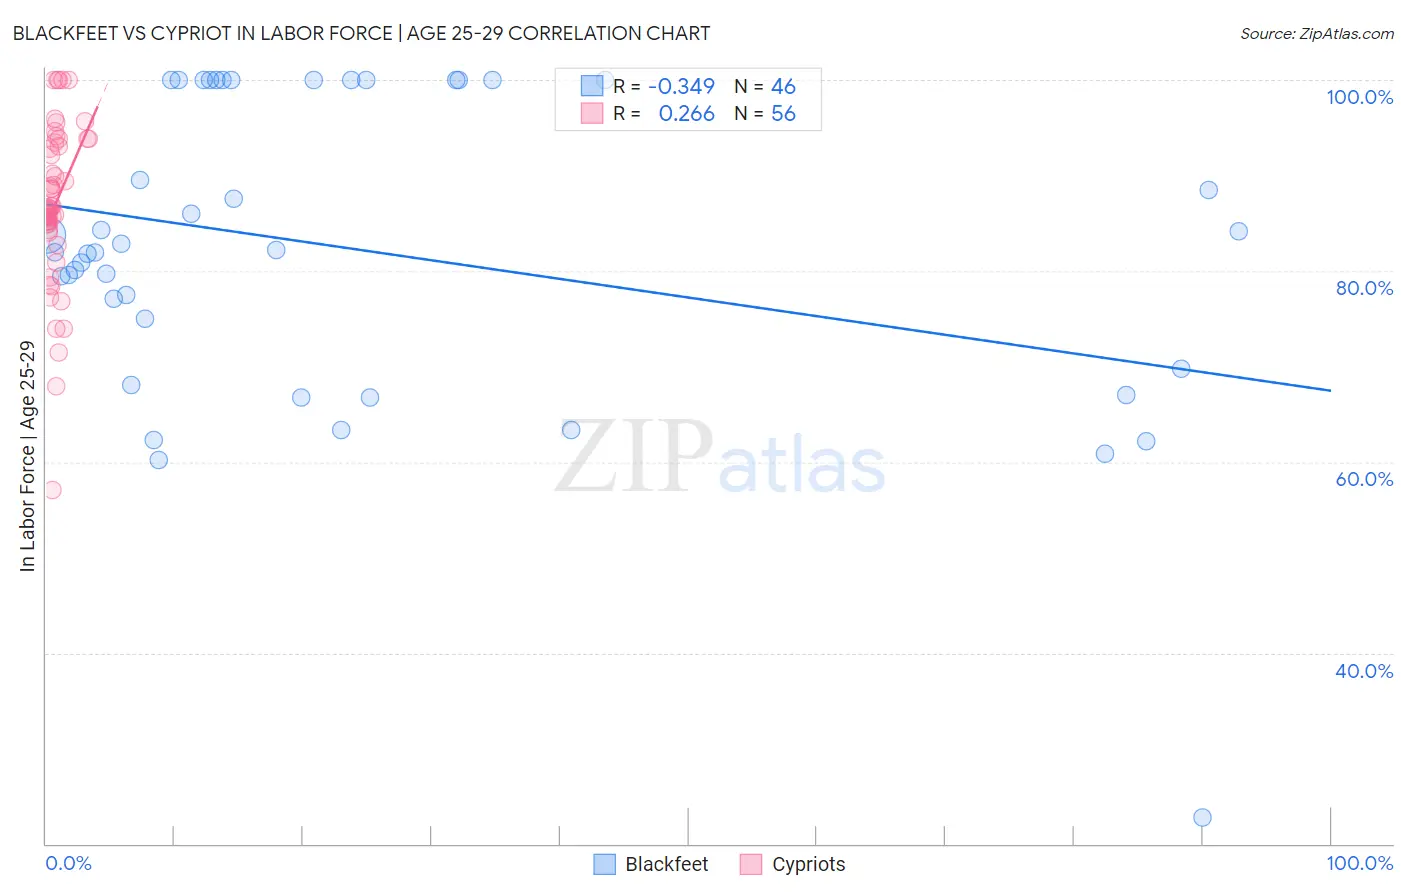
Blackfeet vs Cypriot In Labor Force | Age 25-29 Correlation Chart
The statistical analysis conducted on geographies consisting of 309,474,956 people shows a mild negative correlation between the proportion of Blackfeet and labor force participation rate among population between the ages 25 and 29 in the United States with a correlation coefficient (R) of -0.349 and weighted average of 82.6%. Similarly, the statistical analysis conducted on geographies consisting of 61,853,224 people shows a weak positive correlation between the proportion of Cypriots and labor force participation rate among population between the ages 25 and 29 in the United States with a correlation coefficient (R) of 0.266 and weighted average of 85.8%, a difference of 3.9%.
In Labor Force | Age 25-29 Correlation Summary
| Measurement | Blackfeet | Cypriot |
| Minimum | 22.7% | 57.1% |
| Maximum | 100.0% | 100.0% |
| Range | 77.3% | 42.9% |
| Mean | 82.1% | 86.9% |
| Median | 82.1% | 86.5% |
| Interquartile 25% (IQ1) | 69.8% | 84.6% |
| Interquartile 75% (IQ3) | 100.0% | 93.3% |
| Interquartile Range (IQR) | 30.2% | 8.7% |
| Standard Deviation (Sample) | 16.2% | 8.4% |
| Standard Deviation (Population) | 16.0% | 8.3% |
Similar Demographics by In Labor Force | Age 25-29
Demographics Similar to Blackfeet by In Labor Force | Age 25-29
In terms of in labor force | age 25-29, the demographic groups most similar to Blackfeet are Black/African American (82.6%, a difference of 0.010%), Cajun (82.5%, a difference of 0.060%), Immigrants from St. Vincent and the Grenadines (82.7%, a difference of 0.13%), Central American Indian (82.4%, a difference of 0.21%), and Immigrants from Central America (82.4%, a difference of 0.22%).
| Demographics | Rating | Rank | In Labor Force | Age 25-29 |
| Fijians | 0.0 /100 | #299 | Tragic 82.9% |
| Spanish American Indians | 0.0 /100 | #300 | Tragic 82.9% |
| Vietnamese | 0.0 /100 | #301 | Tragic 82.8% |
| Immigrants | Belize | 0.0 /100 | #302 | Tragic 82.8% |
| Immigrants | Grenada | 0.0 /100 | #303 | Tragic 82.8% |
| Immigrants | St. Vincent and the Grenadines | 0.0 /100 | #304 | Tragic 82.7% |
| Blacks/African Americans | 0.0 /100 | #305 | Tragic 82.6% |
| Blackfeet | 0.0 /100 | #306 | Tragic 82.6% |
| Cajuns | 0.0 /100 | #307 | Tragic 82.5% |
| Central American Indians | 0.0 /100 | #308 | Tragic 82.4% |
| Immigrants | Central America | 0.0 /100 | #309 | Tragic 82.4% |
| Osage | 0.0 /100 | #310 | Tragic 82.3% |
| Alaskan Athabascans | 0.0 /100 | #311 | Tragic 82.3% |
| Hispanics or Latinos | 0.0 /100 | #312 | Tragic 82.2% |
| Yaqui | 0.0 /100 | #313 | Tragic 82.2% |
Demographics Similar to Cypriots by In Labor Force | Age 25-29
In terms of in labor force | age 25-29, the demographic groups most similar to Cypriots are Immigrants from Nepal (85.8%, a difference of 0.0%), Lithuanian (85.8%, a difference of 0.010%), Polish (85.8%, a difference of 0.030%), German Russian (85.8%, a difference of 0.040%), and Slovak (85.8%, a difference of 0.040%).
| Demographics | Rating | Rank | In Labor Force | Age 25-29 |
| Ugandans | 100.0 /100 | #28 | Exceptional 85.9% |
| Immigrants | Liberia | 100.0 /100 | #29 | Exceptional 85.9% |
| Immigrants | Serbia | 100.0 /100 | #30 | Exceptional 85.9% |
| German Russians | 100.0 /100 | #31 | Exceptional 85.8% |
| Slovaks | 100.0 /100 | #32 | Exceptional 85.8% |
| Immigrants | Bulgaria | 100.0 /100 | #33 | Exceptional 85.8% |
| Lithuanians | 99.9 /100 | #34 | Exceptional 85.8% |
| Cypriots | 99.9 /100 | #35 | Exceptional 85.8% |
| Immigrants | Nepal | 99.9 /100 | #36 | Exceptional 85.8% |
| Poles | 99.9 /100 | #37 | Exceptional 85.8% |
| Sierra Leoneans | 99.9 /100 | #38 | Exceptional 85.8% |
| Croatians | 99.9 /100 | #39 | Exceptional 85.8% |
| Immigrants | Albania | 99.9 /100 | #40 | Exceptional 85.7% |
| Immigrants | Greece | 99.9 /100 | #41 | Exceptional 85.7% |
| Immigrants | Eritrea | 99.9 /100 | #42 | Exceptional 85.7% |