Blackfeet vs Celtic Doctorate Degree
COMPARE
Blackfeet
Celtic
Doctorate Degree
Doctorate Degree Comparison
Blackfeet
Celtics
1.5%
DOCTORATE DEGREE
0.7/ 100
METRIC RATING
264th/ 347
METRIC RANK
1.9%
DOCTORATE DEGREE
66.7/ 100
METRIC RATING
164th/ 347
METRIC RANK
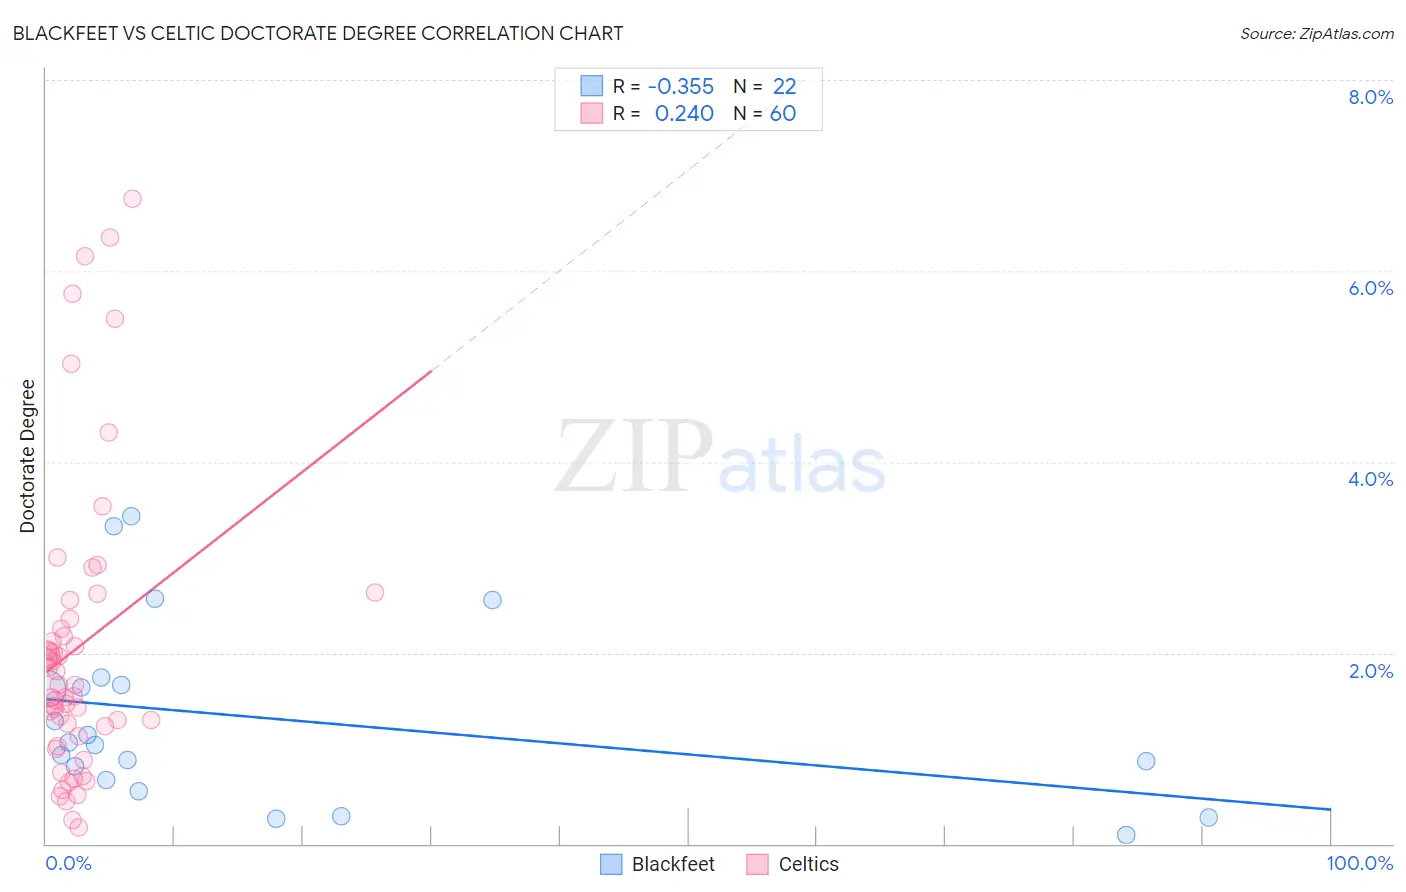
Blackfeet vs Celtic Doctorate Degree Correlation Chart
The statistical analysis conducted on geographies consisting of 304,903,722 people shows a mild negative correlation between the proportion of Blackfeet and percentage of population with at least doctorate degree education in the United States with a correlation coefficient (R) of -0.355 and weighted average of 1.5%. Similarly, the statistical analysis conducted on geographies consisting of 167,913,023 people shows a weak positive correlation between the proportion of Celtics and percentage of population with at least doctorate degree education in the United States with a correlation coefficient (R) of 0.240 and weighted average of 1.9%, a difference of 25.4%.
Doctorate Degree Correlation Summary
| Measurement | Blackfeet | Celtic |
| Minimum | 0.095% | 0.17% |
| Maximum | 3.4% | 6.8% |
| Range | 3.3% | 6.6% |
| Mean | 1.3% | 2.1% |
| Median | 1.0% | 1.7% |
| Interquartile 25% (IQ1) | 0.67% | 1.2% |
| Interquartile 75% (IQ3) | 1.7% | 2.3% |
| Interquartile Range (IQR) | 1.00% | 1.1% |
| Standard Deviation (Sample) | 0.95% | 1.5% |
| Standard Deviation (Population) | 0.93% | 1.5% |
Similar Demographics by Doctorate Degree
Demographics Similar to Blackfeet by Doctorate Degree
In terms of doctorate degree, the demographic groups most similar to Blackfeet are Immigrants from Bahamas (1.5%, a difference of 0.18%), Nicaraguan (1.5%, a difference of 0.28%), Chickasaw (1.5%, a difference of 0.36%), Immigrants from Portugal (1.5%, a difference of 0.51%), and Japanese (1.5%, a difference of 0.97%).
| Demographics | Rating | Rank | Doctorate Degree |
| Chippewa | 0.9 /100 | #257 | Tragic 1.5% |
| Immigrants | West Indies | 0.9 /100 | #258 | Tragic 1.5% |
| Liberians | 0.9 /100 | #259 | Tragic 1.5% |
| Japanese | 0.9 /100 | #260 | Tragic 1.5% |
| Immigrants | Portugal | 0.8 /100 | #261 | Tragic 1.5% |
| Chickasaw | 0.7 /100 | #262 | Tragic 1.5% |
| Immigrants | Bahamas | 0.7 /100 | #263 | Tragic 1.5% |
| Blackfeet | 0.7 /100 | #264 | Tragic 1.5% |
| Nicaraguans | 0.6 /100 | #265 | Tragic 1.5% |
| Immigrants | Liberia | 0.5 /100 | #266 | Tragic 1.5% |
| Kiowa | 0.5 /100 | #267 | Tragic 1.5% |
| U.S. Virgin Islanders | 0.5 /100 | #268 | Tragic 1.5% |
| Crow | 0.5 /100 | #269 | Tragic 1.5% |
| Salvadorans | 0.5 /100 | #270 | Tragic 1.5% |
| Immigrants | Trinidad and Tobago | 0.5 /100 | #271 | Tragic 1.5% |
Demographics Similar to Celtics by Doctorate Degree
In terms of doctorate degree, the demographic groups most similar to Celtics are Czech (1.9%, a difference of 0.10%), Irish (1.9%, a difference of 0.13%), Immigrants from Middle Africa (1.9%, a difference of 0.35%), Scotch-Irish (1.9%, a difference of 0.49%), and Welsh (1.9%, a difference of 0.50%).
| Demographics | Rating | Rank | Doctorate Degree |
| Danes | 71.9 /100 | #157 | Good 1.9% |
| Hungarians | 71.7 /100 | #158 | Good 1.9% |
| Slovenes | 70.2 /100 | #159 | Good 1.9% |
| Welsh | 69.7 /100 | #160 | Good 1.9% |
| Immigrants | Middle Africa | 68.8 /100 | #161 | Good 1.9% |
| Irish | 67.5 /100 | #162 | Good 1.9% |
| Czechs | 67.3 /100 | #163 | Good 1.9% |
| Celtics | 66.7 /100 | #164 | Good 1.9% |
| Scotch-Irish | 63.6 /100 | #165 | Good 1.9% |
| Spaniards | 63.5 /100 | #166 | Good 1.9% |
| Macedonians | 60.9 /100 | #167 | Good 1.9% |
| Sri Lankans | 60.3 /100 | #168 | Good 1.9% |
| Vietnamese | 54.8 /100 | #169 | Average 1.9% |
| Costa Ricans | 53.3 /100 | #170 | Average 1.8% |
| Bermudans | 52.1 /100 | #171 | Average 1.8% |