Immigrants from Trinidad and Tobago vs Iranian 4 or more Vehicles in Household
COMPARE
Immigrants from Trinidad and Tobago
Iranian
4 or more Vehicles in Household
4 or more Vehicles in Household Comparison
Immigrants from Trinidad and Tobago
Iranians
4.1%
4 OR MORE VEHICLES IN HOUSEHOLD
0.0/ 100
METRIC RATING
334th/ 347
METRIC RANK
6.5%
4 OR MORE VEHICLES IN HOUSEHOLD
69.9/ 100
METRIC RATING
156th/ 347
METRIC RANK
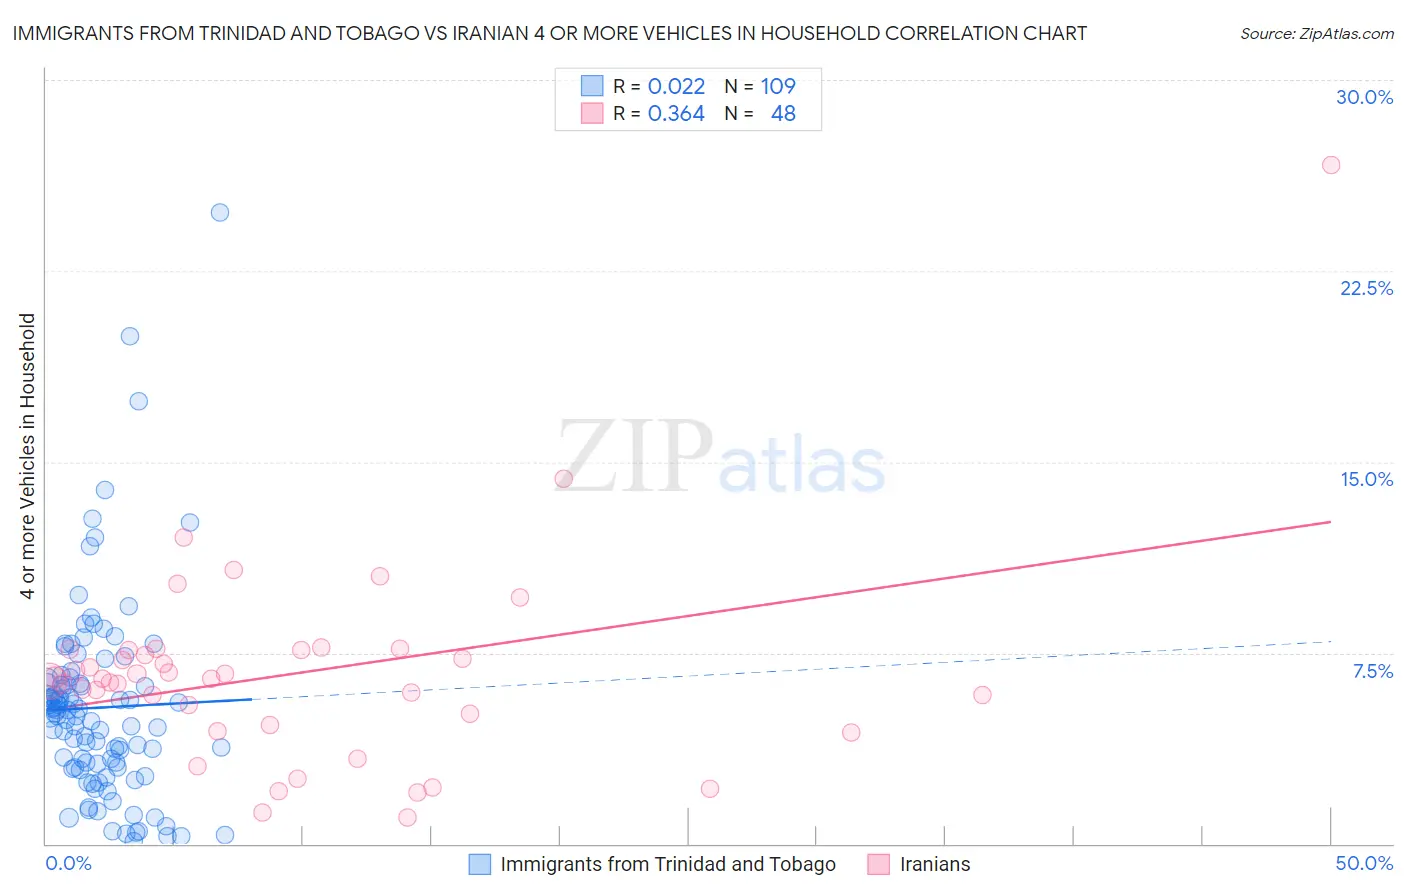
Immigrants from Trinidad and Tobago vs Iranian 4 or more Vehicles in Household Correlation Chart
The statistical analysis conducted on geographies consisting of 222,352,936 people shows no correlation between the proportion of Immigrants from Trinidad and Tobago and percentage of households with 4 or more vehicles available in the United States with a correlation coefficient (R) of 0.022 and weighted average of 4.1%. Similarly, the statistical analysis conducted on geographies consisting of 315,200,253 people shows a mild positive correlation between the proportion of Iranians and percentage of households with 4 or more vehicles available in the United States with a correlation coefficient (R) of 0.364 and weighted average of 6.5%, a difference of 57.3%.
4 or more Vehicles in Household Correlation Summary
| Measurement | Immigrants from Trinidad and Tobago | Iranian |
| Minimum | 0.11% | 1.1% |
| Maximum | 24.8% | 26.7% |
| Range | 24.7% | 25.6% |
| Mean | 5.3% | 6.7% |
| Median | 5.0% | 6.5% |
| Interquartile 25% (IQ1) | 3.0% | 4.9% |
| Interquartile 75% (IQ3) | 6.4% | 7.6% |
| Interquartile Range (IQR) | 3.4% | 2.7% |
| Standard Deviation (Sample) | 3.9% | 4.0% |
| Standard Deviation (Population) | 3.9% | 4.0% |
Similar Demographics by 4 or more Vehicles in Household
Demographics Similar to Immigrants from Trinidad and Tobago by 4 or more Vehicles in Household
In terms of 4 or more vehicles in household, the demographic groups most similar to Immigrants from Trinidad and Tobago are Immigrants from Albania (4.1%, a difference of 0.21%), Immigrants from Dominica (4.2%, a difference of 1.9%), West Indian (4.2%, a difference of 2.8%), Immigrants from Ecuador (4.2%, a difference of 3.1%), and Immigrants from Senegal (4.2%, a difference of 3.3%).
| Demographics | Rating | Rank | 4 or more Vehicles in Household |
| Senegalese | 0.0 /100 | #327 | Tragic 4.3% |
| Trinidadians and Tobagonians | 0.0 /100 | #328 | Tragic 4.3% |
| Immigrants | Senegal | 0.0 /100 | #329 | Tragic 4.2% |
| Immigrants | Ecuador | 0.0 /100 | #330 | Tragic 4.2% |
| West Indians | 0.0 /100 | #331 | Tragic 4.2% |
| Immigrants | Dominica | 0.0 /100 | #332 | Tragic 4.2% |
| Immigrants | Albania | 0.0 /100 | #333 | Tragic 4.1% |
| Immigrants | Trinidad and Tobago | 0.0 /100 | #334 | Tragic 4.1% |
| Barbadians | 0.0 /100 | #335 | Tragic 3.9% |
| Immigrants | Bangladesh | 0.0 /100 | #336 | Tragic 3.9% |
| Vietnamese | 0.0 /100 | #337 | Tragic 3.9% |
| Immigrants | Cabo Verde | 0.0 /100 | #338 | Tragic 3.8% |
| Immigrants | Uzbekistan | 0.0 /100 | #339 | Tragic 3.6% |
| Immigrants | Barbados | 0.0 /100 | #340 | Tragic 3.6% |
| Dominicans | 0.0 /100 | #341 | Tragic 3.5% |
Demographics Similar to Iranians by 4 or more Vehicles in Household
In terms of 4 or more vehicles in household, the demographic groups most similar to Iranians are Peruvian (6.5%, a difference of 0.050%), Iroquois (6.5%, a difference of 0.060%), Central American Indian (6.5%, a difference of 0.14%), Immigrants from Armenia (6.5%, a difference of 0.16%), and Yuman (6.5%, a difference of 0.27%).
| Demographics | Rating | Rank | 4 or more Vehicles in Household |
| Greeks | 73.6 /100 | #149 | Good 6.5% |
| New Zealanders | 73.3 /100 | #150 | Good 6.5% |
| Immigrants | Hong Kong | 72.2 /100 | #151 | Good 6.5% |
| Yuman | 72.1 /100 | #152 | Good 6.5% |
| Immigrants | Armenia | 71.2 /100 | #153 | Good 6.5% |
| Central American Indians | 71.1 /100 | #154 | Good 6.5% |
| Iroquois | 70.4 /100 | #155 | Good 6.5% |
| Iranians | 69.9 /100 | #156 | Good 6.5% |
| Peruvians | 69.4 /100 | #157 | Good 6.5% |
| Zimbabweans | 67.1 /100 | #158 | Good 6.4% |
| Indians (Asian) | 66.3 /100 | #159 | Good 6.4% |
| Palestinians | 65.8 /100 | #160 | Good 6.4% |
| Immigrants | Cameroon | 64.4 /100 | #161 | Good 6.4% |
| Immigrants | Pakistan | 63.2 /100 | #162 | Good 6.4% |
| Chileans | 61.2 /100 | #163 | Good 6.4% |