Basque vs Immigrants from Pakistan 1 or more Vehicles in Household
COMPARE
Basque
Immigrants from Pakistan
1 or more Vehicles in Household
1 or more Vehicles in Household Comparison
Basques
Immigrants from Pakistan
92.4%
1 OR MORE VEHICLES IN HOUSEHOLD
100.0/ 100
METRIC RATING
32nd/ 347
METRIC RANK
88.6%
1 OR MORE VEHICLES IN HOUSEHOLD
4.5/ 100
METRIC RATING
236th/ 347
METRIC RANK
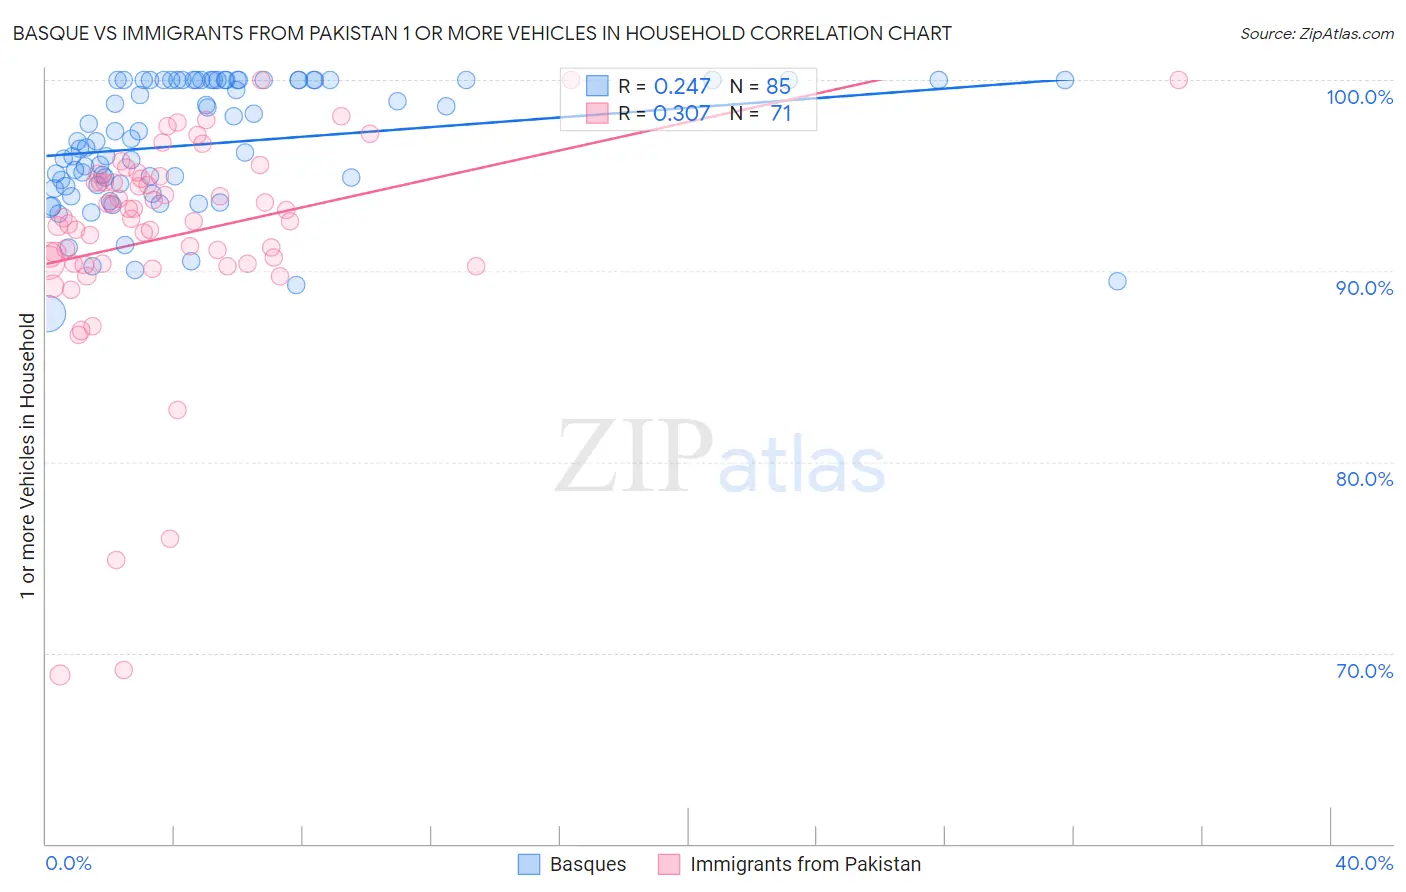
Basque vs Immigrants from Pakistan 1 or more Vehicles in Household Correlation Chart
The statistical analysis conducted on geographies consisting of 165,757,280 people shows a weak positive correlation between the proportion of Basques and percentage of households with 1 or more vehicles available in the United States with a correlation coefficient (R) of 0.247 and weighted average of 92.4%. Similarly, the statistical analysis conducted on geographies consisting of 283,704,699 people shows a mild positive correlation between the proportion of Immigrants from Pakistan and percentage of households with 1 or more vehicles available in the United States with a correlation coefficient (R) of 0.307 and weighted average of 88.6%, a difference of 4.3%.
1 or more Vehicles in Household Correlation Summary
| Measurement | Basque | Immigrants from Pakistan |
| Minimum | 87.7% | 68.8% |
| Maximum | 100.0% | 100.0% |
| Range | 12.3% | 31.2% |
| Mean | 96.7% | 91.9% |
| Median | 96.8% | 92.7% |
| Interquartile 25% (IQ1) | 94.5% | 90.4% |
| Interquartile 75% (IQ3) | 100.0% | 94.8% |
| Interquartile Range (IQR) | 5.5% | 4.4% |
| Standard Deviation (Sample) | 3.3% | 5.9% |
| Standard Deviation (Population) | 3.2% | 5.8% |
Similar Demographics by 1 or more Vehicles in Household
Demographics Similar to Basques by 1 or more Vehicles in Household
In terms of 1 or more vehicles in household, the demographic groups most similar to Basques are Cherokee (92.4%, a difference of 0.010%), Samoan (92.4%, a difference of 0.040%), Native Hawaiian (92.4%, a difference of 0.050%), Finnish (92.4%, a difference of 0.050%), and Sri Lankan (92.5%, a difference of 0.070%).
| Demographics | Rating | Rank | 1 or more Vehicles in Household |
| Immigrants | Iraq | 100.0 /100 | #25 | Exceptional 92.5% |
| British | 100.0 /100 | #26 | Exceptional 92.5% |
| Americans | 100.0 /100 | #27 | Exceptional 92.5% |
| Sri Lankans | 100.0 /100 | #28 | Exceptional 92.5% |
| Native Hawaiians | 100.0 /100 | #29 | Exceptional 92.4% |
| Finns | 100.0 /100 | #30 | Exceptional 92.4% |
| Samoans | 100.0 /100 | #31 | Exceptional 92.4% |
| Basques | 100.0 /100 | #32 | Exceptional 92.4% |
| Cherokee | 100.0 /100 | #33 | Exceptional 92.4% |
| Italians | 99.9 /100 | #34 | Exceptional 92.3% |
| Czechoslovakians | 99.9 /100 | #35 | Exceptional 92.3% |
| Malaysians | 99.9 /100 | #36 | Exceptional 92.3% |
| French Canadians | 99.9 /100 | #37 | Exceptional 92.3% |
| Immigrants | Vietnam | 99.9 /100 | #38 | Exceptional 92.3% |
| Swiss | 99.9 /100 | #39 | Exceptional 92.3% |
Demographics Similar to Immigrants from Pakistan by 1 or more Vehicles in Household
In terms of 1 or more vehicles in household, the demographic groups most similar to Immigrants from Pakistan are Paiute (88.6%, a difference of 0.010%), Immigrants from Turkey (88.6%, a difference of 0.010%), Immigrants from Peru (88.6%, a difference of 0.020%), Houma (88.6%, a difference of 0.030%), and Immigrants from Somalia (88.6%, a difference of 0.030%).
| Demographics | Rating | Rank | 1 or more Vehicles in Household |
| Immigrants | Romania | 5.4 /100 | #229 | Tragic 88.7% |
| Immigrants | Sierra Leone | 5.2 /100 | #230 | Tragic 88.7% |
| Russians | 5.0 /100 | #231 | Tragic 88.7% |
| Immigrants | Japan | 4.9 /100 | #232 | Tragic 88.7% |
| Houma | 4.8 /100 | #233 | Tragic 88.6% |
| Immigrants | Peru | 4.7 /100 | #234 | Tragic 88.6% |
| Paiute | 4.6 /100 | #235 | Tragic 88.6% |
| Immigrants | Pakistan | 4.5 /100 | #236 | Tragic 88.6% |
| Immigrants | Turkey | 4.4 /100 | #237 | Tragic 88.6% |
| Immigrants | Somalia | 4.2 /100 | #238 | Tragic 88.6% |
| Kiowa | 3.8 /100 | #239 | Tragic 88.6% |
| Eastern Europeans | 3.0 /100 | #240 | Tragic 88.5% |
| Taiwanese | 2.6 /100 | #241 | Tragic 88.4% |
| Turks | 2.5 /100 | #242 | Tragic 88.4% |
| Immigrants | Belgium | 2.1 /100 | #243 | Tragic 88.4% |