Basque vs Immigrants from Guatemala 1 or more Vehicles in Household
COMPARE
Basque
Immigrants from Guatemala
1 or more Vehicles in Household
1 or more Vehicles in Household Comparison
Basques
Immigrants from Guatemala
92.4%
1 OR MORE VEHICLES IN HOUSEHOLD
100.0/ 100
METRIC RATING
32nd/ 347
METRIC RANK
88.9%
1 OR MORE VEHICLES IN HOUSEHOLD
8.6/ 100
METRIC RATING
219th/ 347
METRIC RANK
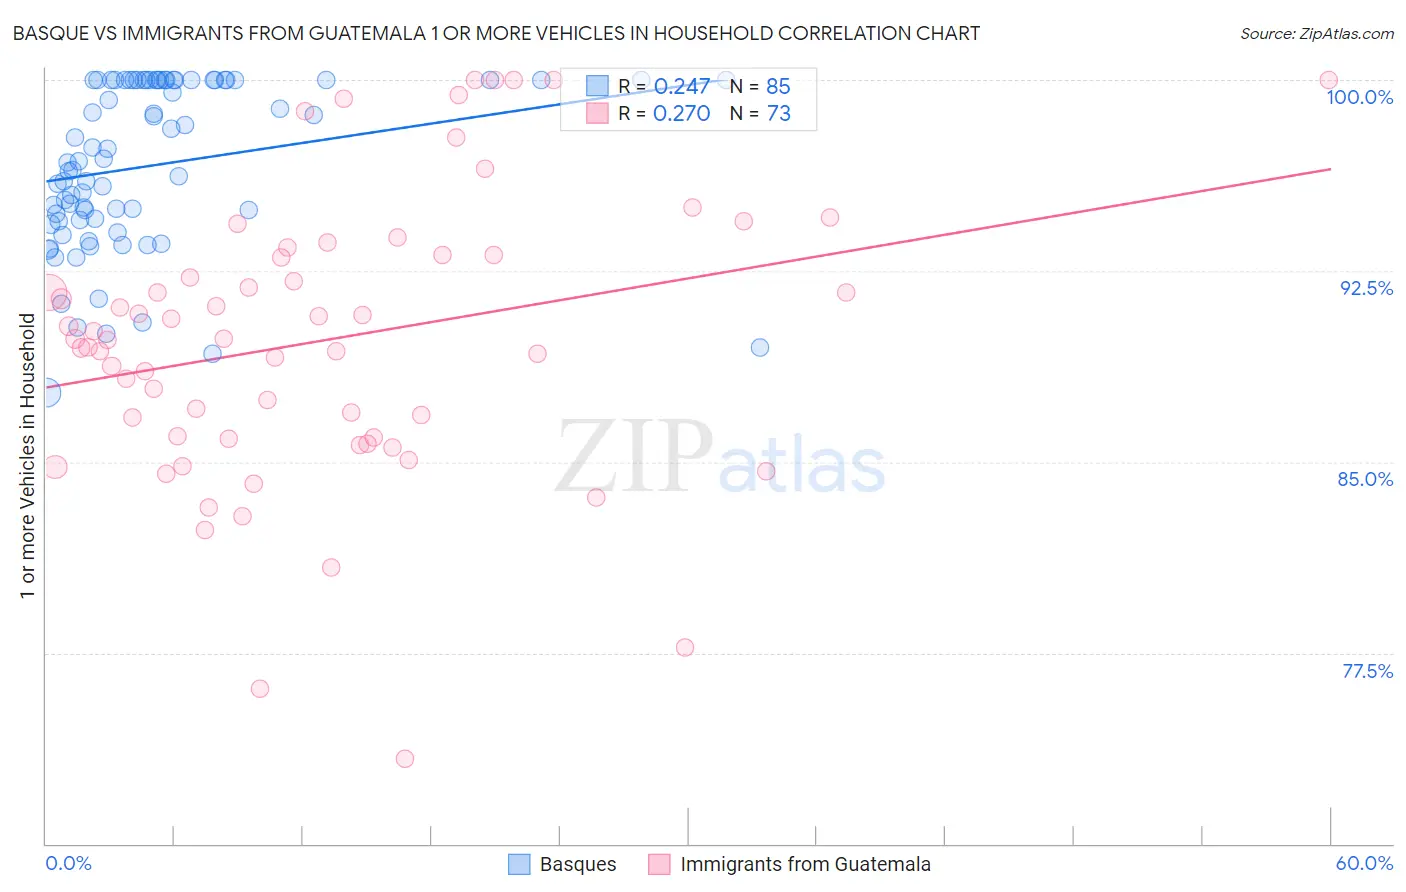
Basque vs Immigrants from Guatemala 1 or more Vehicles in Household Correlation Chart
The statistical analysis conducted on geographies consisting of 165,757,280 people shows a weak positive correlation between the proportion of Basques and percentage of households with 1 or more vehicles available in the United States with a correlation coefficient (R) of 0.247 and weighted average of 92.4%. Similarly, the statistical analysis conducted on geographies consisting of 377,136,668 people shows a weak positive correlation between the proportion of Immigrants from Guatemala and percentage of households with 1 or more vehicles available in the United States with a correlation coefficient (R) of 0.270 and weighted average of 88.9%, a difference of 4.0%.
1 or more Vehicles in Household Correlation Summary
| Measurement | Basque | Immigrants from Guatemala |
| Minimum | 87.7% | 73.4% |
| Maximum | 100.0% | 100.0% |
| Range | 12.3% | 26.6% |
| Mean | 96.7% | 89.8% |
| Median | 96.8% | 89.8% |
| Interquartile 25% (IQ1) | 94.5% | 85.9% |
| Interquartile 75% (IQ3) | 100.0% | 93.1% |
| Interquartile Range (IQR) | 5.5% | 7.2% |
| Standard Deviation (Sample) | 3.3% | 5.6% |
| Standard Deviation (Population) | 3.2% | 5.6% |
Similar Demographics by 1 or more Vehicles in Household
Demographics Similar to Basques by 1 or more Vehicles in Household
In terms of 1 or more vehicles in household, the demographic groups most similar to Basques are Cherokee (92.4%, a difference of 0.010%), Samoan (92.4%, a difference of 0.040%), Native Hawaiian (92.4%, a difference of 0.050%), Finnish (92.4%, a difference of 0.050%), and Sri Lankan (92.5%, a difference of 0.070%).
| Demographics | Rating | Rank | 1 or more Vehicles in Household |
| Immigrants | Iraq | 100.0 /100 | #25 | Exceptional 92.5% |
| British | 100.0 /100 | #26 | Exceptional 92.5% |
| Americans | 100.0 /100 | #27 | Exceptional 92.5% |
| Sri Lankans | 100.0 /100 | #28 | Exceptional 92.5% |
| Native Hawaiians | 100.0 /100 | #29 | Exceptional 92.4% |
| Finns | 100.0 /100 | #30 | Exceptional 92.4% |
| Samoans | 100.0 /100 | #31 | Exceptional 92.4% |
| Basques | 100.0 /100 | #32 | Exceptional 92.4% |
| Cherokee | 100.0 /100 | #33 | Exceptional 92.4% |
| Italians | 99.9 /100 | #34 | Exceptional 92.3% |
| Czechoslovakians | 99.9 /100 | #35 | Exceptional 92.3% |
| Malaysians | 99.9 /100 | #36 | Exceptional 92.3% |
| French Canadians | 99.9 /100 | #37 | Exceptional 92.3% |
| Immigrants | Vietnam | 99.9 /100 | #38 | Exceptional 92.3% |
| Swiss | 99.9 /100 | #39 | Exceptional 92.3% |
Demographics Similar to Immigrants from Guatemala by 1 or more Vehicles in Household
In terms of 1 or more vehicles in household, the demographic groups most similar to Immigrants from Guatemala are Ugandan (88.9%, a difference of 0.0%), Argentinean (88.9%, a difference of 0.010%), Immigrants from Zaire (88.8%, a difference of 0.030%), Immigrants from Argentina (88.9%, a difference of 0.040%), and Peruvian (88.8%, a difference of 0.040%).
| Demographics | Rating | Rank | 1 or more Vehicles in Household |
| Somalis | 12.8 /100 | #212 | Poor 89.0% |
| Immigrants | Western Asia | 12.3 /100 | #213 | Poor 89.0% |
| Immigrants | Hungary | 11.9 /100 | #214 | Poor 89.0% |
| Immigrants | Sri Lanka | 10.2 /100 | #215 | Poor 88.9% |
| Immigrants | Argentina | 9.4 /100 | #216 | Tragic 88.9% |
| Argentineans | 8.8 /100 | #217 | Tragic 88.9% |
| Ugandans | 8.7 /100 | #218 | Tragic 88.9% |
| Immigrants | Guatemala | 8.6 /100 | #219 | Tragic 88.9% |
| Immigrants | Zaire | 8.1 /100 | #220 | Tragic 88.8% |
| Peruvians | 7.9 /100 | #221 | Tragic 88.8% |
| Uruguayans | 7.0 /100 | #222 | Tragic 88.8% |
| Immigrants | South America | 7.0 /100 | #223 | Tragic 88.8% |
| Immigrants | Hong Kong | 6.2 /100 | #224 | Tragic 88.7% |
| Cree | 6.0 /100 | #225 | Tragic 88.7% |
| Cheyenne | 5.7 /100 | #226 | Tragic 88.7% |