Basque vs Immigrants from Afghanistan 1 or more Vehicles in Household
COMPARE
Basque
Immigrants from Afghanistan
1 or more Vehicles in Household
1 or more Vehicles in Household Comparison
Basques
Immigrants from Afghanistan
92.4%
1 OR MORE VEHICLES IN HOUSEHOLD
100.0/ 100
METRIC RATING
32nd/ 347
METRIC RANK
92.0%
1 OR MORE VEHICLES IN HOUSEHOLD
99.9/ 100
METRIC RATING
55th/ 347
METRIC RANK
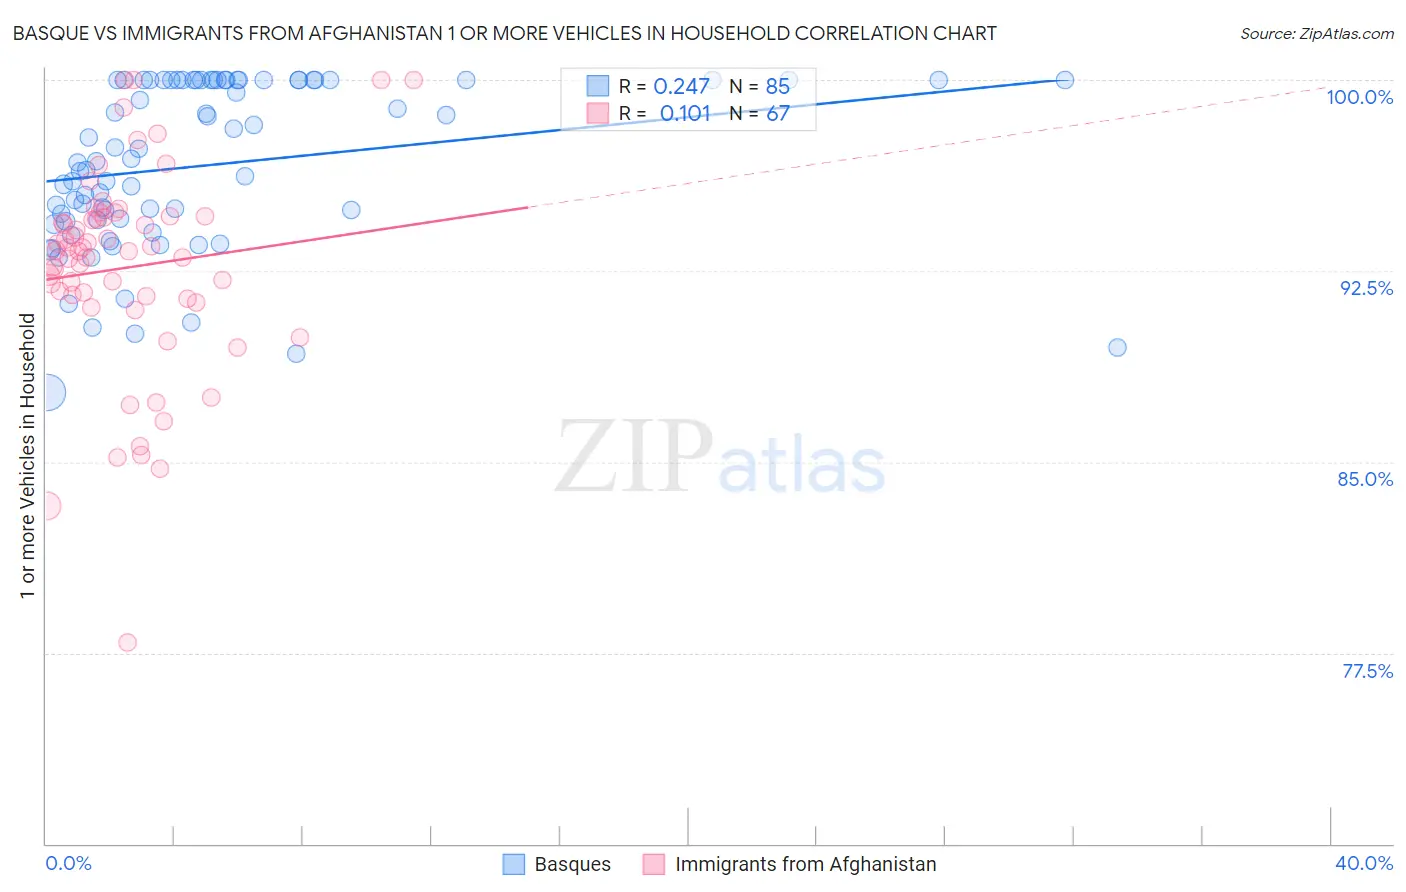
Basque vs Immigrants from Afghanistan 1 or more Vehicles in Household Correlation Chart
The statistical analysis conducted on geographies consisting of 165,757,280 people shows a weak positive correlation between the proportion of Basques and percentage of households with 1 or more vehicles available in the United States with a correlation coefficient (R) of 0.247 and weighted average of 92.4%. Similarly, the statistical analysis conducted on geographies consisting of 147,625,417 people shows a poor positive correlation between the proportion of Immigrants from Afghanistan and percentage of households with 1 or more vehicles available in the United States with a correlation coefficient (R) of 0.101 and weighted average of 92.0%, a difference of 0.45%.
1 or more Vehicles in Household Correlation Summary
| Measurement | Basque | Immigrants from Afghanistan |
| Minimum | 87.7% | 77.9% |
| Maximum | 100.0% | 100.0% |
| Range | 12.3% | 22.1% |
| Mean | 96.7% | 92.6% |
| Median | 96.8% | 93.3% |
| Interquartile 25% (IQ1) | 94.5% | 91.4% |
| Interquartile 75% (IQ3) | 100.0% | 94.6% |
| Interquartile Range (IQR) | 5.5% | 3.2% |
| Standard Deviation (Sample) | 3.3% | 4.1% |
| Standard Deviation (Population) | 3.2% | 4.1% |
Similar Demographics by 1 or more Vehicles in Household
Demographics Similar to Basques by 1 or more Vehicles in Household
In terms of 1 or more vehicles in household, the demographic groups most similar to Basques are Cherokee (92.4%, a difference of 0.010%), Samoan (92.4%, a difference of 0.040%), Native Hawaiian (92.4%, a difference of 0.050%), Finnish (92.4%, a difference of 0.050%), and Sri Lankan (92.5%, a difference of 0.070%).
| Demographics | Rating | Rank | 1 or more Vehicles in Household |
| Immigrants | Iraq | 100.0 /100 | #25 | Exceptional 92.5% |
| British | 100.0 /100 | #26 | Exceptional 92.5% |
| Americans | 100.0 /100 | #27 | Exceptional 92.5% |
| Sri Lankans | 100.0 /100 | #28 | Exceptional 92.5% |
| Native Hawaiians | 100.0 /100 | #29 | Exceptional 92.4% |
| Finns | 100.0 /100 | #30 | Exceptional 92.4% |
| Samoans | 100.0 /100 | #31 | Exceptional 92.4% |
| Basques | 100.0 /100 | #32 | Exceptional 92.4% |
| Cherokee | 100.0 /100 | #33 | Exceptional 92.4% |
| Italians | 99.9 /100 | #34 | Exceptional 92.3% |
| Czechoslovakians | 99.9 /100 | #35 | Exceptional 92.3% |
| Malaysians | 99.9 /100 | #36 | Exceptional 92.3% |
| French Canadians | 99.9 /100 | #37 | Exceptional 92.3% |
| Immigrants | Vietnam | 99.9 /100 | #38 | Exceptional 92.3% |
| Swiss | 99.9 /100 | #39 | Exceptional 92.3% |
Demographics Similar to Immigrants from Afghanistan by 1 or more Vehicles in Household
In terms of 1 or more vehicles in household, the demographic groups most similar to Immigrants from Afghanistan are Immigrants from Venezuela (92.0%, a difference of 0.0%), Iraqi (91.9%, a difference of 0.040%), Slovene (92.0%, a difference of 0.060%), Immigrants from Mexico (91.9%, a difference of 0.060%), and Hawaiian (92.0%, a difference of 0.070%).
| Demographics | Rating | Rank | 1 or more Vehicles in Household |
| Belgians | 99.9 /100 | #48 | Exceptional 92.1% |
| Afghans | 99.9 /100 | #49 | Exceptional 92.1% |
| Guamanians/Chamorros | 99.9 /100 | #50 | Exceptional 92.1% |
| Celtics | 99.9 /100 | #51 | Exceptional 92.1% |
| Koreans | 99.9 /100 | #52 | Exceptional 92.1% |
| Hawaiians | 99.9 /100 | #53 | Exceptional 92.0% |
| Slovenes | 99.9 /100 | #54 | Exceptional 92.0% |
| Immigrants | Afghanistan | 99.9 /100 | #55 | Exceptional 92.0% |
| Immigrants | Venezuela | 99.9 /100 | #56 | Exceptional 92.0% |
| Iraqis | 99.8 /100 | #57 | Exceptional 91.9% |
| Immigrants | Mexico | 99.8 /100 | #58 | Exceptional 91.9% |
| Venezuelans | 99.8 /100 | #59 | Exceptional 91.9% |
| Slovaks | 99.8 /100 | #60 | Exceptional 91.9% |
| Immigrants | India | 99.8 /100 | #61 | Exceptional 91.9% |
| Thais | 99.8 /100 | #62 | Exceptional 91.9% |