Basque vs Yuman No Schooling Completed
COMPARE
Basque
Yuman
No Schooling Completed
No Schooling Completed Comparison
Basques
Yuman
1.8%
NO SCHOOLING COMPLETED
97.9/ 100
METRIC RATING
103rd/ 347
METRIC RANK
2.5%
NO SCHOOLING COMPLETED
0.4/ 100
METRIC RATING
267th/ 347
METRIC RANK
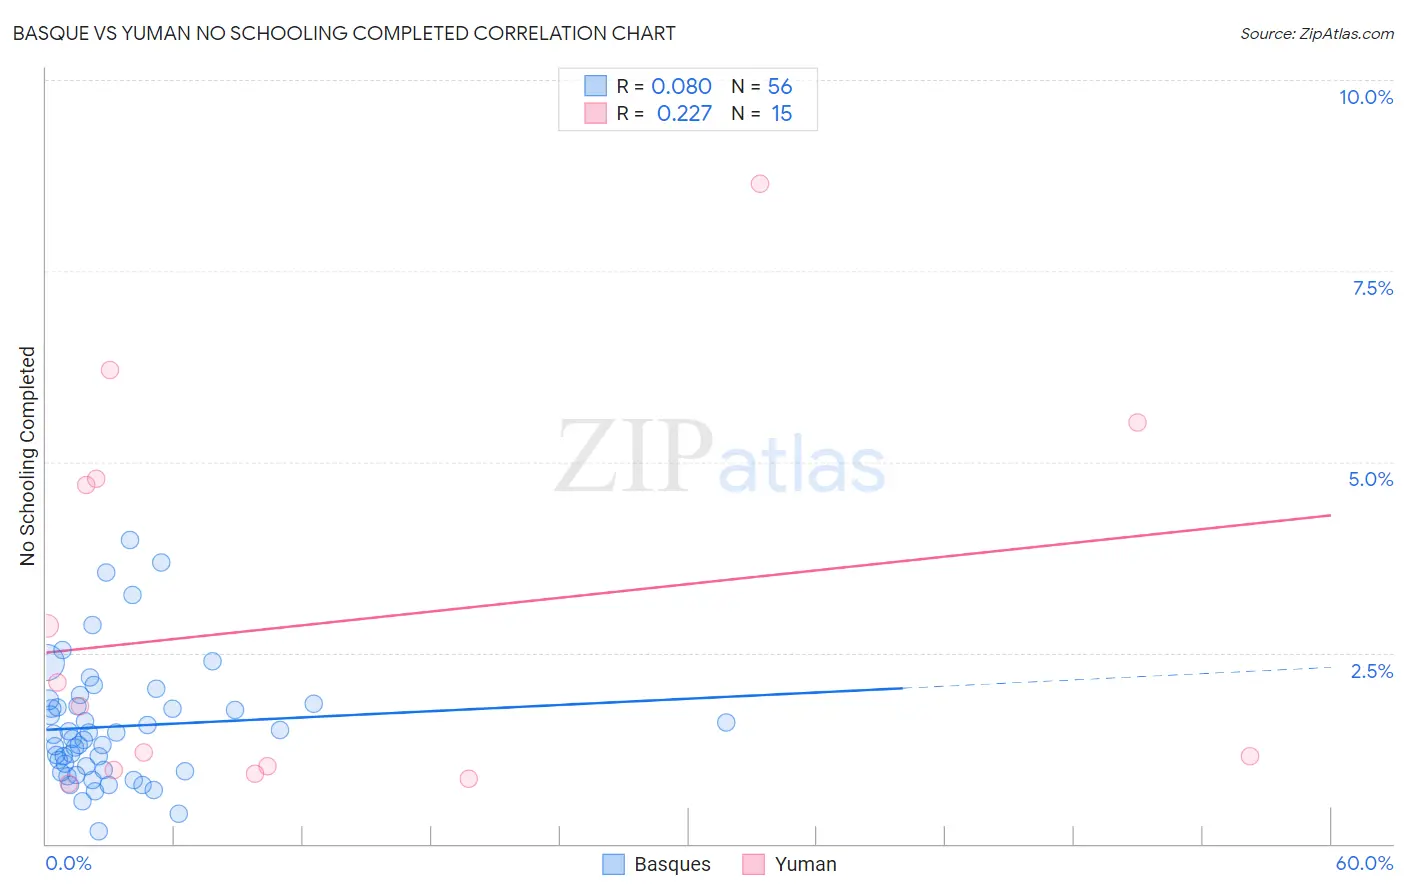
Basque vs Yuman No Schooling Completed Correlation Chart
The statistical analysis conducted on geographies consisting of 164,919,642 people shows a slight positive correlation between the proportion of Basques and percentage of population with no schooling in the United States with a correlation coefficient (R) of 0.080 and weighted average of 1.8%. Similarly, the statistical analysis conducted on geographies consisting of 40,618,798 people shows a weak positive correlation between the proportion of Yuman and percentage of population with no schooling in the United States with a correlation coefficient (R) of 0.227 and weighted average of 2.5%, a difference of 36.3%.
No Schooling Completed Correlation Summary
| Measurement | Basque | Yuman |
| Minimum | 0.17% | 0.78% |
| Maximum | 4.0% | 8.6% |
| Range | 3.8% | 7.9% |
| Mean | 1.5% | 2.9% |
| Median | 1.4% | 1.8% |
| Interquartile 25% (IQ1) | 0.96% | 0.96% |
| Interquartile 75% (IQ3) | 1.8% | 4.8% |
| Interquartile Range (IQR) | 0.85% | 3.8% |
| Standard Deviation (Sample) | 0.80% | 2.5% |
| Standard Deviation (Population) | 0.79% | 2.4% |
Similar Demographics by No Schooling Completed
Demographics Similar to Basques by No Schooling Completed
In terms of no schooling completed, the demographic groups most similar to Basques are Immigrants from Switzerland (1.8%, a difference of 0.050%), Immigrants from Czechoslovakia (1.8%, a difference of 0.060%), Immigrants from Singapore (1.8%, a difference of 0.35%), Choctaw (1.8%, a difference of 0.55%), and Thai (1.8%, a difference of 0.57%).
| Demographics | Rating | Rank | No Schooling Completed |
| Bhutanese | 98.4 /100 | #96 | Exceptional 1.8% |
| Immigrants | Ireland | 98.4 /100 | #97 | Exceptional 1.8% |
| Iranians | 98.2 /100 | #98 | Exceptional 1.8% |
| Choctaw | 98.1 /100 | #99 | Exceptional 1.8% |
| Immigrants | Singapore | 98.0 /100 | #100 | Exceptional 1.8% |
| Immigrants | Czechoslovakia | 97.9 /100 | #101 | Exceptional 1.8% |
| Immigrants | Switzerland | 97.9 /100 | #102 | Exceptional 1.8% |
| Basques | 97.9 /100 | #103 | Exceptional 1.8% |
| Thais | 97.5 /100 | #104 | Exceptional 1.8% |
| German Russians | 97.5 /100 | #105 | Exceptional 1.8% |
| Immigrants | France | 97.3 /100 | #106 | Exceptional 1.8% |
| Yugoslavians | 97.2 /100 | #107 | Exceptional 1.8% |
| Okinawans | 97.1 /100 | #108 | Exceptional 1.8% |
| Immigrants | Saudi Arabia | 96.8 /100 | #109 | Exceptional 1.9% |
| Immigrants | Latvia | 96.7 /100 | #110 | Exceptional 1.9% |
Demographics Similar to Yuman by No Schooling Completed
In terms of no schooling completed, the demographic groups most similar to Yuman are Fijian (2.5%, a difference of 0.17%), West Indian (2.5%, a difference of 0.25%), Taiwanese (2.5%, a difference of 0.26%), Indian (Asian) (2.5%, a difference of 0.43%), and Immigrants from Liberia (2.5%, a difference of 0.56%).
| Demographics | Rating | Rank | No Schooling Completed |
| Immigrants | Ethiopia | 0.6 /100 | #260 | Tragic 2.5% |
| Armenians | 0.5 /100 | #261 | Tragic 2.5% |
| Immigrants | Sierra Leone | 0.5 /100 | #262 | Tragic 2.5% |
| Immigrants | Liberia | 0.4 /100 | #263 | Tragic 2.5% |
| Indians (Asian) | 0.4 /100 | #264 | Tragic 2.5% |
| West Indians | 0.4 /100 | #265 | Tragic 2.5% |
| Fijians | 0.4 /100 | #266 | Tragic 2.5% |
| Yuman | 0.4 /100 | #267 | Tragic 2.5% |
| Taiwanese | 0.3 /100 | #268 | Tragic 2.5% |
| Immigrants | Nigeria | 0.2 /100 | #269 | Tragic 2.5% |
| Immigrants | Peru | 0.2 /100 | #270 | Tragic 2.5% |
| Cubans | 0.2 /100 | #271 | Tragic 2.5% |
| Immigrants | Bolivia | 0.2 /100 | #272 | Tragic 2.5% |
| Immigrants | Cameroon | 0.1 /100 | #273 | Tragic 2.5% |
| Ghanaians | 0.1 /100 | #274 | Tragic 2.6% |