Bahamian vs Osage 4 or more Vehicles in Household
COMPARE
Bahamian
Osage
4 or more Vehicles in Household
4 or more Vehicles in Household Comparison
Bahamians
Osage
5.1%
4 OR MORE VEHICLES IN HOUSEHOLD
0.0/ 100
METRIC RATING
302nd/ 347
METRIC RANK
7.8%
4 OR MORE VEHICLES IN HOUSEHOLD
100.0/ 100
METRIC RATING
47th/ 347
METRIC RANK
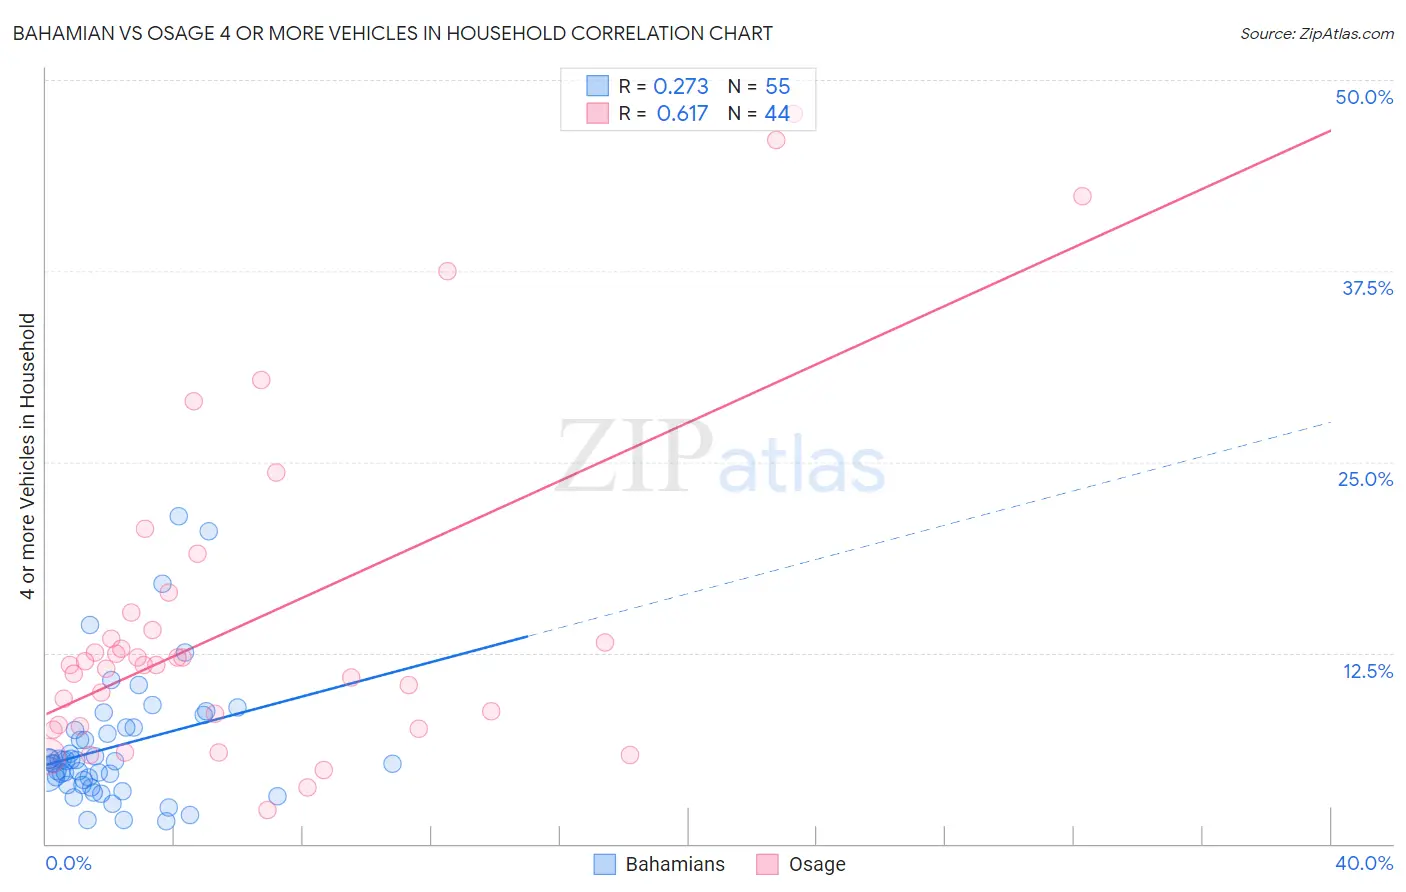
Bahamian vs Osage 4 or more Vehicles in Household Correlation Chart
The statistical analysis conducted on geographies consisting of 112,347,492 people shows a weak positive correlation between the proportion of Bahamians and percentage of households with 4 or more vehicles available in the United States with a correlation coefficient (R) of 0.273 and weighted average of 5.1%. Similarly, the statistical analysis conducted on geographies consisting of 91,747,496 people shows a significant positive correlation between the proportion of Osage and percentage of households with 4 or more vehicles available in the United States with a correlation coefficient (R) of 0.617 and weighted average of 7.8%, a difference of 53.0%.
4 or more Vehicles in Household Correlation Summary
| Measurement | Bahamian | Osage |
| Minimum | 1.5% | 2.2% |
| Maximum | 21.5% | 47.8% |
| Range | 20.0% | 45.7% |
| Mean | 6.4% | 14.6% |
| Median | 5.4% | 11.7% |
| Interquartile 25% (IQ1) | 3.9% | 7.7% |
| Interquartile 75% (IQ3) | 7.6% | 14.6% |
| Interquartile Range (IQR) | 3.7% | 6.8% |
| Standard Deviation (Sample) | 4.2% | 11.0% |
| Standard Deviation (Population) | 4.1% | 10.9% |
Similar Demographics by 4 or more Vehicles in Household
Demographics Similar to Bahamians by 4 or more Vehicles in Household
In terms of 4 or more vehicles in household, the demographic groups most similar to Bahamians are Immigrants from Zaire (5.1%, a difference of 0.31%), Immigrants from Morocco (5.1%, a difference of 0.39%), Immigrants from Greece (5.1%, a difference of 0.47%), Cypriot (5.0%, a difference of 1.0%), and Somali (5.0%, a difference of 1.0%).
| Demographics | Rating | Rank | 4 or more Vehicles in Household |
| Immigrants | Brazil | 0.1 /100 | #295 | Tragic 5.2% |
| Israelis | 0.1 /100 | #296 | Tragic 5.2% |
| Immigrants | Venezuela | 0.1 /100 | #297 | Tragic 5.2% |
| Immigrants | South America | 0.1 /100 | #298 | Tragic 5.2% |
| Immigrants | Ghana | 0.1 /100 | #299 | Tragic 5.2% |
| Immigrants | Morocco | 0.0 /100 | #300 | Tragic 5.1% |
| Immigrants | Zaire | 0.0 /100 | #301 | Tragic 5.1% |
| Bahamians | 0.0 /100 | #302 | Tragic 5.1% |
| Immigrants | Greece | 0.0 /100 | #303 | Tragic 5.1% |
| Cypriots | 0.0 /100 | #304 | Tragic 5.0% |
| Somalis | 0.0 /100 | #305 | Tragic 5.0% |
| Immigrants | Serbia | 0.0 /100 | #306 | Tragic 5.0% |
| Menominee | 0.0 /100 | #307 | Tragic 5.0% |
| Paraguayans | 0.0 /100 | #308 | Tragic 4.9% |
| Immigrants | Somalia | 0.0 /100 | #309 | Tragic 4.9% |
Demographics Similar to Osage by 4 or more Vehicles in Household
In terms of 4 or more vehicles in household, the demographic groups most similar to Osage are Crow (7.8%, a difference of 0.16%), Swiss (7.8%, a difference of 0.17%), Choctaw (7.8%, a difference of 0.33%), Cherokee (7.7%, a difference of 0.36%), and Bhutanese (7.8%, a difference of 0.38%).
| Demographics | Rating | Rank | 4 or more Vehicles in Household |
| Spanish | 100.0 /100 | #40 | Exceptional 7.9% |
| Pima | 100.0 /100 | #41 | Exceptional 7.9% |
| Salvadorans | 100.0 /100 | #42 | Exceptional 7.8% |
| Fijians | 100.0 /100 | #43 | Exceptional 7.8% |
| Bhutanese | 100.0 /100 | #44 | Exceptional 7.8% |
| Choctaw | 100.0 /100 | #45 | Exceptional 7.8% |
| Crow | 100.0 /100 | #46 | Exceptional 7.8% |
| Osage | 100.0 /100 | #47 | Exceptional 7.8% |
| Swiss | 100.0 /100 | #48 | Exceptional 7.8% |
| Cherokee | 100.0 /100 | #49 | Exceptional 7.7% |
| Immigrants | El Salvador | 100.0 /100 | #50 | Exceptional 7.7% |
| Immigrants | Laos | 100.0 /100 | #51 | Exceptional 7.7% |
| Japanese | 100.0 /100 | #52 | Exceptional 7.7% |
| Malaysians | 100.0 /100 | #53 | Exceptional 7.7% |
| Dutch | 100.0 /100 | #54 | Exceptional 7.7% |