Pakistani vs Osage 4 or more Vehicles in Household
COMPARE
Pakistani
Osage
4 or more Vehicles in Household
4 or more Vehicles in Household Comparison
Pakistanis
Osage
7.0%
4 OR MORE VEHICLES IN HOUSEHOLD
98.7/ 100
METRIC RATING
101st/ 347
METRIC RANK
7.8%
4 OR MORE VEHICLES IN HOUSEHOLD
100.0/ 100
METRIC RATING
47th/ 347
METRIC RANK
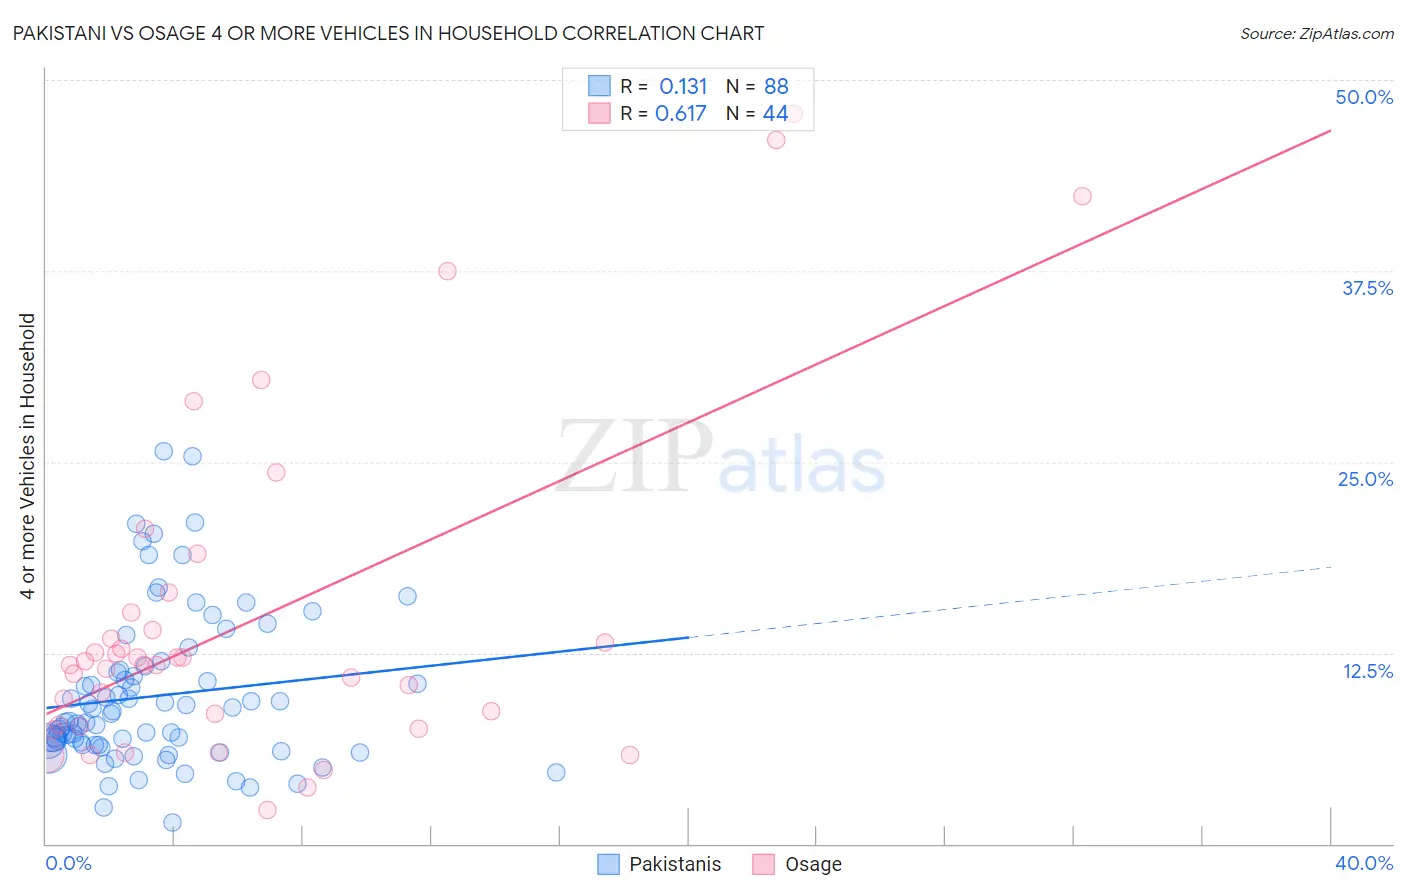
Pakistani vs Osage 4 or more Vehicles in Household Correlation Chart
The statistical analysis conducted on geographies consisting of 334,097,212 people shows a poor positive correlation between the proportion of Pakistanis and percentage of households with 4 or more vehicles available in the United States with a correlation coefficient (R) of 0.131 and weighted average of 7.0%. Similarly, the statistical analysis conducted on geographies consisting of 91,747,496 people shows a significant positive correlation between the proportion of Osage and percentage of households with 4 or more vehicles available in the United States with a correlation coefficient (R) of 0.617 and weighted average of 7.8%, a difference of 10.7%.
4 or more Vehicles in Household Correlation Summary
| Measurement | Pakistani | Osage |
| Minimum | 1.4% | 2.2% |
| Maximum | 25.7% | 47.8% |
| Range | 24.2% | 45.7% |
| Mean | 9.7% | 14.6% |
| Median | 8.0% | 11.7% |
| Interquartile 25% (IQ1) | 6.4% | 7.7% |
| Interquartile 75% (IQ3) | 11.3% | 14.6% |
| Interquartile Range (IQR) | 4.9% | 6.8% |
| Standard Deviation (Sample) | 5.0% | 11.0% |
| Standard Deviation (Population) | 5.0% | 10.9% |
Similar Demographics by 4 or more Vehicles in Household
Demographics Similar to Pakistanis by 4 or more Vehicles in Household
In terms of 4 or more vehicles in household, the demographic groups most similar to Pakistanis are Taiwanese (7.0%, a difference of 0.070%), Asian (7.0%, a difference of 0.070%), Blackfeet (7.0%, a difference of 0.080%), Seminole (7.0%, a difference of 0.15%), and Hmong (7.0%, a difference of 0.56%).
| Demographics | Rating | Rank | 4 or more Vehicles in Household |
| Dutch West Indians | 99.3 /100 | #94 | Exceptional 7.1% |
| Czechoslovakians | 99.3 /100 | #95 | Exceptional 7.1% |
| Central Americans | 99.3 /100 | #96 | Exceptional 7.1% |
| Celtics | 99.1 /100 | #97 | Exceptional 7.1% |
| Irish | 99.0 /100 | #98 | Exceptional 7.1% |
| Seminole | 98.8 /100 | #99 | Exceptional 7.0% |
| Taiwanese | 98.7 /100 | #100 | Exceptional 7.0% |
| Pakistanis | 98.7 /100 | #101 | Exceptional 7.0% |
| Asians | 98.6 /100 | #102 | Exceptional 7.0% |
| Blackfeet | 98.6 /100 | #103 | Exceptional 7.0% |
| Hmong | 98.3 /100 | #104 | Exceptional 7.0% |
| German Russians | 98.3 /100 | #105 | Exceptional 7.0% |
| Guatemalans | 98.1 /100 | #106 | Exceptional 7.0% |
| Nicaraguans | 98.0 /100 | #107 | Exceptional 7.0% |
| French | 97.7 /100 | #108 | Exceptional 6.9% |
Demographics Similar to Osage by 4 or more Vehicles in Household
In terms of 4 or more vehicles in household, the demographic groups most similar to Osage are Crow (7.8%, a difference of 0.16%), Swiss (7.8%, a difference of 0.17%), Choctaw (7.8%, a difference of 0.33%), Cherokee (7.7%, a difference of 0.36%), and Bhutanese (7.8%, a difference of 0.38%).
| Demographics | Rating | Rank | 4 or more Vehicles in Household |
| Spanish | 100.0 /100 | #40 | Exceptional 7.9% |
| Pima | 100.0 /100 | #41 | Exceptional 7.9% |
| Salvadorans | 100.0 /100 | #42 | Exceptional 7.8% |
| Fijians | 100.0 /100 | #43 | Exceptional 7.8% |
| Bhutanese | 100.0 /100 | #44 | Exceptional 7.8% |
| Choctaw | 100.0 /100 | #45 | Exceptional 7.8% |
| Crow | 100.0 /100 | #46 | Exceptional 7.8% |
| Osage | 100.0 /100 | #47 | Exceptional 7.8% |
| Swiss | 100.0 /100 | #48 | Exceptional 7.8% |
| Cherokee | 100.0 /100 | #49 | Exceptional 7.7% |
| Immigrants | El Salvador | 100.0 /100 | #50 | Exceptional 7.7% |
| Immigrants | Laos | 100.0 /100 | #51 | Exceptional 7.7% |
| Japanese | 100.0 /100 | #52 | Exceptional 7.7% |
| Malaysians | 100.0 /100 | #53 | Exceptional 7.7% |
| Dutch | 100.0 /100 | #54 | Exceptional 7.7% |