Bahamian vs Osage Receiving Food Stamps
COMPARE
Bahamian
Osage
Receiving Food Stamps
Receiving Food Stamps Comparison
Bahamians
Osage
17.0%
RECEIVING FOOD STAMPS
0.0/ 100
METRIC RATING
315th/ 347
METRIC RANK
11.7%
RECEIVING FOOD STAMPS
49.8/ 100
METRIC RATING
175th/ 347
METRIC RANK
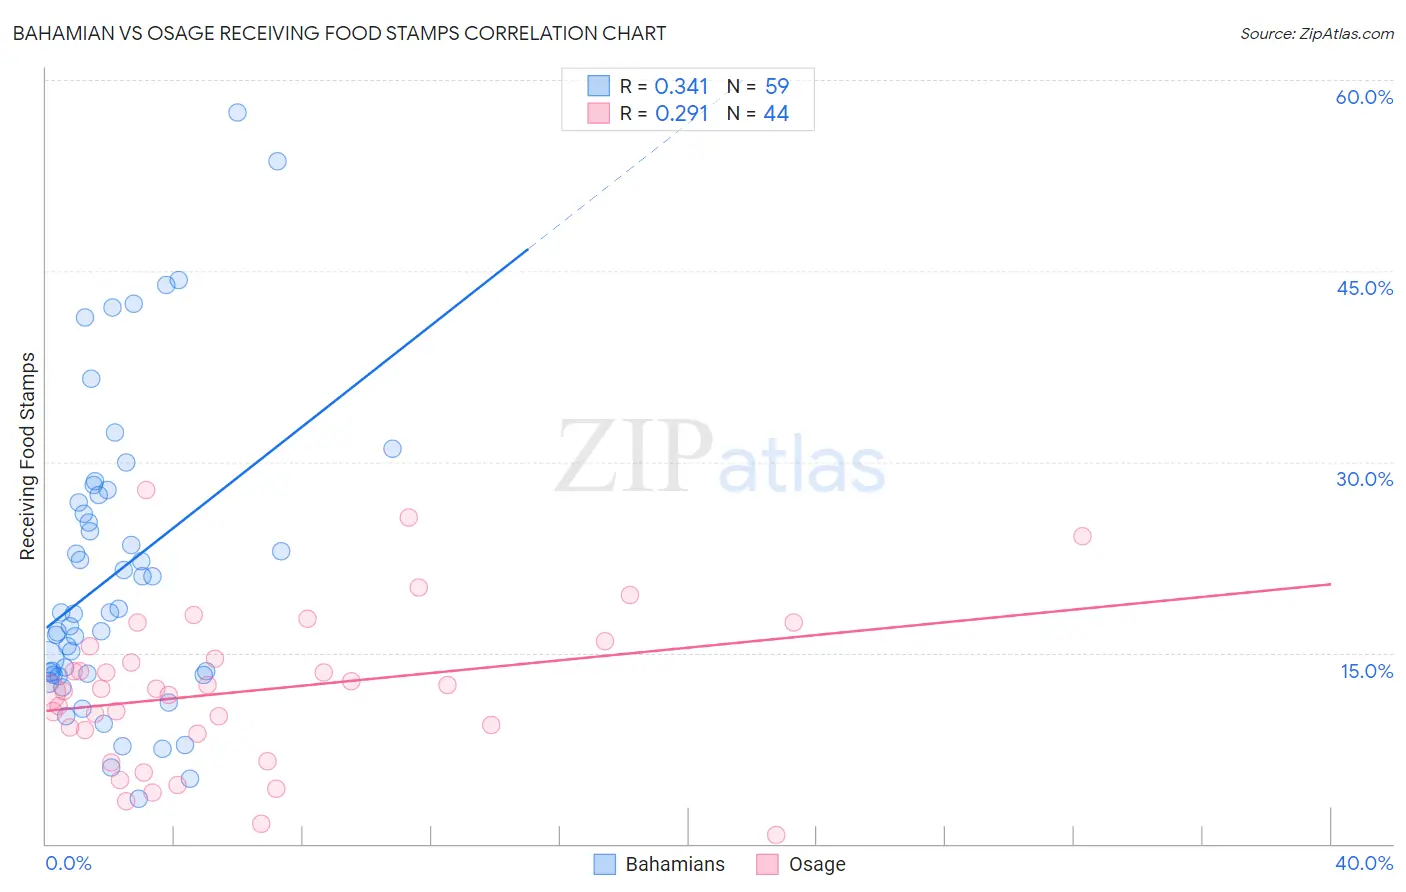
Bahamian vs Osage Receiving Food Stamps Correlation Chart
The statistical analysis conducted on geographies consisting of 112,602,600 people shows a mild positive correlation between the proportion of Bahamians and percentage of population receiving government assistance and/or food stamps in the United States with a correlation coefficient (R) of 0.341 and weighted average of 17.0%. Similarly, the statistical analysis conducted on geographies consisting of 91,766,497 people shows a weak positive correlation between the proportion of Osage and percentage of population receiving government assistance and/or food stamps in the United States with a correlation coefficient (R) of 0.291 and weighted average of 11.7%, a difference of 44.8%.
Receiving Food Stamps Correlation Summary
| Measurement | Bahamian | Osage |
| Minimum | 3.5% | 0.70% |
| Maximum | 57.4% | 27.8% |
| Range | 53.9% | 27.1% |
| Mean | 21.3% | 12.0% |
| Median | 18.1% | 12.1% |
| Interquartile 25% (IQ1) | 13.3% | 8.7% |
| Interquartile 75% (IQ3) | 27.4% | 15.0% |
| Interquartile Range (IQR) | 14.1% | 6.3% |
| Standard Deviation (Sample) | 11.9% | 6.1% |
| Standard Deviation (Population) | 11.8% | 6.0% |
Similar Demographics by Receiving Food Stamps
Demographics Similar to Bahamians by Receiving Food Stamps
In terms of receiving food stamps, the demographic groups most similar to Bahamians are Central American Indian (17.1%, a difference of 0.45%), Immigrants from Guyana (16.9%, a difference of 0.57%), Immigrants from Jamaica (16.9%, a difference of 0.74%), Black/African American (17.2%, a difference of 0.98%), and Sioux (16.8%, a difference of 1.0%).
| Demographics | Rating | Rank | Receiving Food Stamps |
| Barbadians | 0.0 /100 | #308 | Tragic 16.5% |
| U.S. Virgin Islanders | 0.0 /100 | #309 | Tragic 16.5% |
| Immigrants | Barbados | 0.0 /100 | #310 | Tragic 16.6% |
| Guyanese | 0.0 /100 | #311 | Tragic 16.7% |
| Sioux | 0.0 /100 | #312 | Tragic 16.8% |
| Immigrants | Jamaica | 0.0 /100 | #313 | Tragic 16.9% |
| Immigrants | Guyana | 0.0 /100 | #314 | Tragic 16.9% |
| Bahamians | 0.0 /100 | #315 | Tragic 17.0% |
| Central American Indians | 0.0 /100 | #316 | Tragic 17.1% |
| Blacks/African Americans | 0.0 /100 | #317 | Tragic 17.2% |
| Menominee | 0.0 /100 | #318 | Tragic 17.2% |
| Immigrants | St. Vincent and the Grenadines | 0.0 /100 | #319 | Tragic 17.2% |
| Immigrants | Nicaragua | 0.0 /100 | #320 | Tragic 17.2% |
| Natives/Alaskans | 0.0 /100 | #321 | Tragic 17.3% |
| Immigrants | Grenada | 0.0 /100 | #322 | Tragic 17.8% |
Demographics Similar to Osage by Receiving Food Stamps
In terms of receiving food stamps, the demographic groups most similar to Osage are Immigrants from Eritrea (11.7%, a difference of 0.020%), Peruvian (11.7%, a difference of 0.070%), Immigrants from Ukraine (11.8%, a difference of 0.21%), German Russian (11.8%, a difference of 0.24%), and Immigrants from Kenya (11.8%, a difference of 0.48%).
| Demographics | Rating | Rank | Receiving Food Stamps |
| Tlingit-Haida | 59.1 /100 | #168 | Average 11.6% |
| Immigrants | Eastern Africa | 58.3 /100 | #169 | Average 11.6% |
| Costa Ricans | 57.9 /100 | #170 | Average 11.6% |
| Immigrants | Western Asia | 56.4 /100 | #171 | Average 11.6% |
| Guamanians/Chamorros | 54.2 /100 | #172 | Average 11.7% |
| Immigrants | Syria | 53.4 /100 | #173 | Average 11.7% |
| Immigrants | Eritrea | 50.0 /100 | #174 | Average 11.7% |
| Osage | 49.8 /100 | #175 | Average 11.7% |
| Peruvians | 49.3 /100 | #176 | Average 11.7% |
| Immigrants | Ukraine | 48.4 /100 | #177 | Average 11.8% |
| German Russians | 48.1 /100 | #178 | Average 11.8% |
| Immigrants | Kenya | 46.4 /100 | #179 | Average 11.8% |
| Uruguayans | 44.8 /100 | #180 | Average 11.8% |
| South American Indians | 41.7 /100 | #181 | Average 11.9% |
| Immigrants | Morocco | 40.7 /100 | #182 | Average 11.9% |