Mexican American Indian vs Osage 4 or more Vehicles in Household
COMPARE
Mexican American Indian
Osage
4 or more Vehicles in Household
4 or more Vehicles in Household Comparison
Mexican American Indians
Osage
8.4%
4 OR MORE VEHICLES IN HOUSEHOLD
100.0/ 100
METRIC RATING
26th/ 347
METRIC RANK
7.8%
4 OR MORE VEHICLES IN HOUSEHOLD
100.0/ 100
METRIC RATING
47th/ 347
METRIC RANK
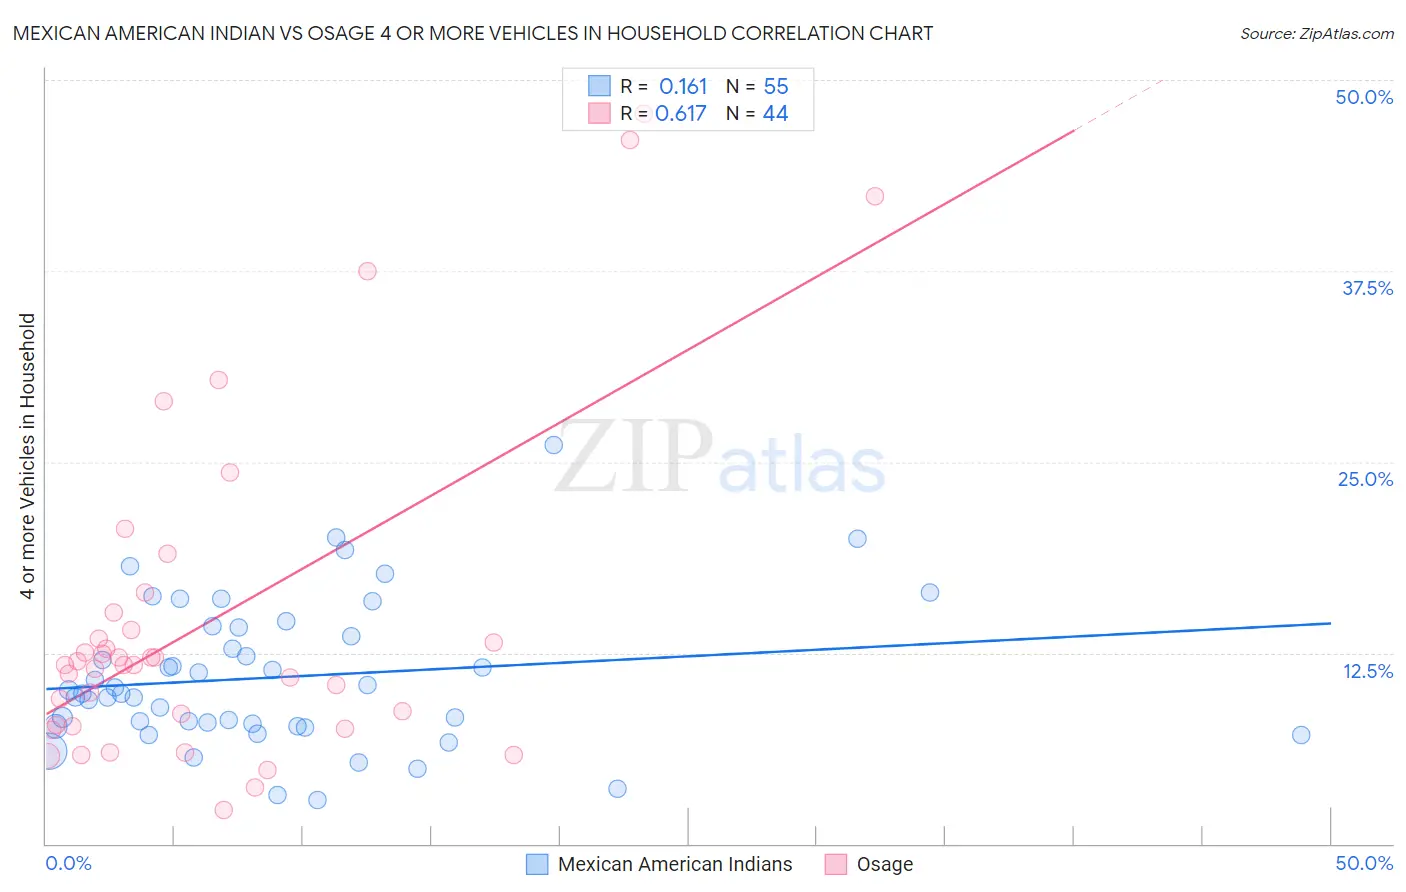
Mexican American Indian vs Osage 4 or more Vehicles in Household Correlation Chart
The statistical analysis conducted on geographies consisting of 316,602,557 people shows a poor positive correlation between the proportion of Mexican American Indians and percentage of households with 4 or more vehicles available in the United States with a correlation coefficient (R) of 0.161 and weighted average of 8.4%. Similarly, the statistical analysis conducted on geographies consisting of 91,747,496 people shows a significant positive correlation between the proportion of Osage and percentage of households with 4 or more vehicles available in the United States with a correlation coefficient (R) of 0.617 and weighted average of 7.8%, a difference of 8.2%.
4 or more Vehicles in Household Correlation Summary
| Measurement | Mexican American Indian | Osage |
| Minimum | 2.9% | 2.2% |
| Maximum | 26.1% | 47.8% |
| Range | 23.2% | 45.7% |
| Mean | 10.9% | 14.6% |
| Median | 9.8% | 11.7% |
| Interquartile 25% (IQ1) | 7.7% | 7.7% |
| Interquartile 75% (IQ3) | 14.1% | 14.6% |
| Interquartile Range (IQR) | 6.4% | 6.8% |
| Standard Deviation (Sample) | 4.7% | 11.0% |
| Standard Deviation (Population) | 4.7% | 10.9% |
Similar Demographics by 4 or more Vehicles in Household
Demographics Similar to Mexican American Indians by 4 or more Vehicles in Household
In terms of 4 or more vehicles in household, the demographic groups most similar to Mexican American Indians are Sri Lankan (8.4%, a difference of 0.12%), Basque (8.4%, a difference of 0.31%), Immigrants from Central America (8.5%, a difference of 0.86%), Cheyenne (8.3%, a difference of 1.5%), and Immigrants from Philippines (8.5%, a difference of 1.7%).
| Demographics | Rating | Rank | 4 or more Vehicles in Household |
| Koreans | 100.0 /100 | #19 | Exceptional 8.6% |
| Pueblo | 100.0 /100 | #20 | Exceptional 8.6% |
| Danes | 100.0 /100 | #21 | Exceptional 8.6% |
| Immigrants | Vietnam | 100.0 /100 | #22 | Exceptional 8.6% |
| Immigrants | Philippines | 100.0 /100 | #23 | Exceptional 8.5% |
| Immigrants | Central America | 100.0 /100 | #24 | Exceptional 8.5% |
| Basques | 100.0 /100 | #25 | Exceptional 8.4% |
| Mexican American Indians | 100.0 /100 | #26 | Exceptional 8.4% |
| Sri Lankans | 100.0 /100 | #27 | Exceptional 8.4% |
| Cheyenne | 100.0 /100 | #28 | Exceptional 8.3% |
| Immigrants | South Eastern Asia | 100.0 /100 | #29 | Exceptional 8.2% |
| Navajo | 100.0 /100 | #30 | Exceptional 8.2% |
| Natives/Alaskans | 100.0 /100 | #31 | Exceptional 8.2% |
| Marshallese | 100.0 /100 | #32 | Exceptional 8.1% |
| Yaqui | 100.0 /100 | #33 | Exceptional 8.1% |
Demographics Similar to Osage by 4 or more Vehicles in Household
In terms of 4 or more vehicles in household, the demographic groups most similar to Osage are Crow (7.8%, a difference of 0.16%), Swiss (7.8%, a difference of 0.17%), Choctaw (7.8%, a difference of 0.33%), Cherokee (7.7%, a difference of 0.36%), and Bhutanese (7.8%, a difference of 0.38%).
| Demographics | Rating | Rank | 4 or more Vehicles in Household |
| Spanish | 100.0 /100 | #40 | Exceptional 7.9% |
| Pima | 100.0 /100 | #41 | Exceptional 7.9% |
| Salvadorans | 100.0 /100 | #42 | Exceptional 7.8% |
| Fijians | 100.0 /100 | #43 | Exceptional 7.8% |
| Bhutanese | 100.0 /100 | #44 | Exceptional 7.8% |
| Choctaw | 100.0 /100 | #45 | Exceptional 7.8% |
| Crow | 100.0 /100 | #46 | Exceptional 7.8% |
| Osage | 100.0 /100 | #47 | Exceptional 7.8% |
| Swiss | 100.0 /100 | #48 | Exceptional 7.8% |
| Cherokee | 100.0 /100 | #49 | Exceptional 7.7% |
| Immigrants | El Salvador | 100.0 /100 | #50 | Exceptional 7.7% |
| Immigrants | Laos | 100.0 /100 | #51 | Exceptional 7.7% |
| Japanese | 100.0 /100 | #52 | Exceptional 7.7% |
| Malaysians | 100.0 /100 | #53 | Exceptional 7.7% |
| Dutch | 100.0 /100 | #54 | Exceptional 7.7% |