Hawaiian vs Osage 4 or more Vehicles in Household
COMPARE
Hawaiian
Osage
4 or more Vehicles in Household
4 or more Vehicles in Household Comparison
Hawaiians
Osage
8.9%
4 OR MORE VEHICLES IN HOUSEHOLD
100.0/ 100
METRIC RATING
13th/ 347
METRIC RANK
7.8%
4 OR MORE VEHICLES IN HOUSEHOLD
100.0/ 100
METRIC RATING
47th/ 347
METRIC RANK
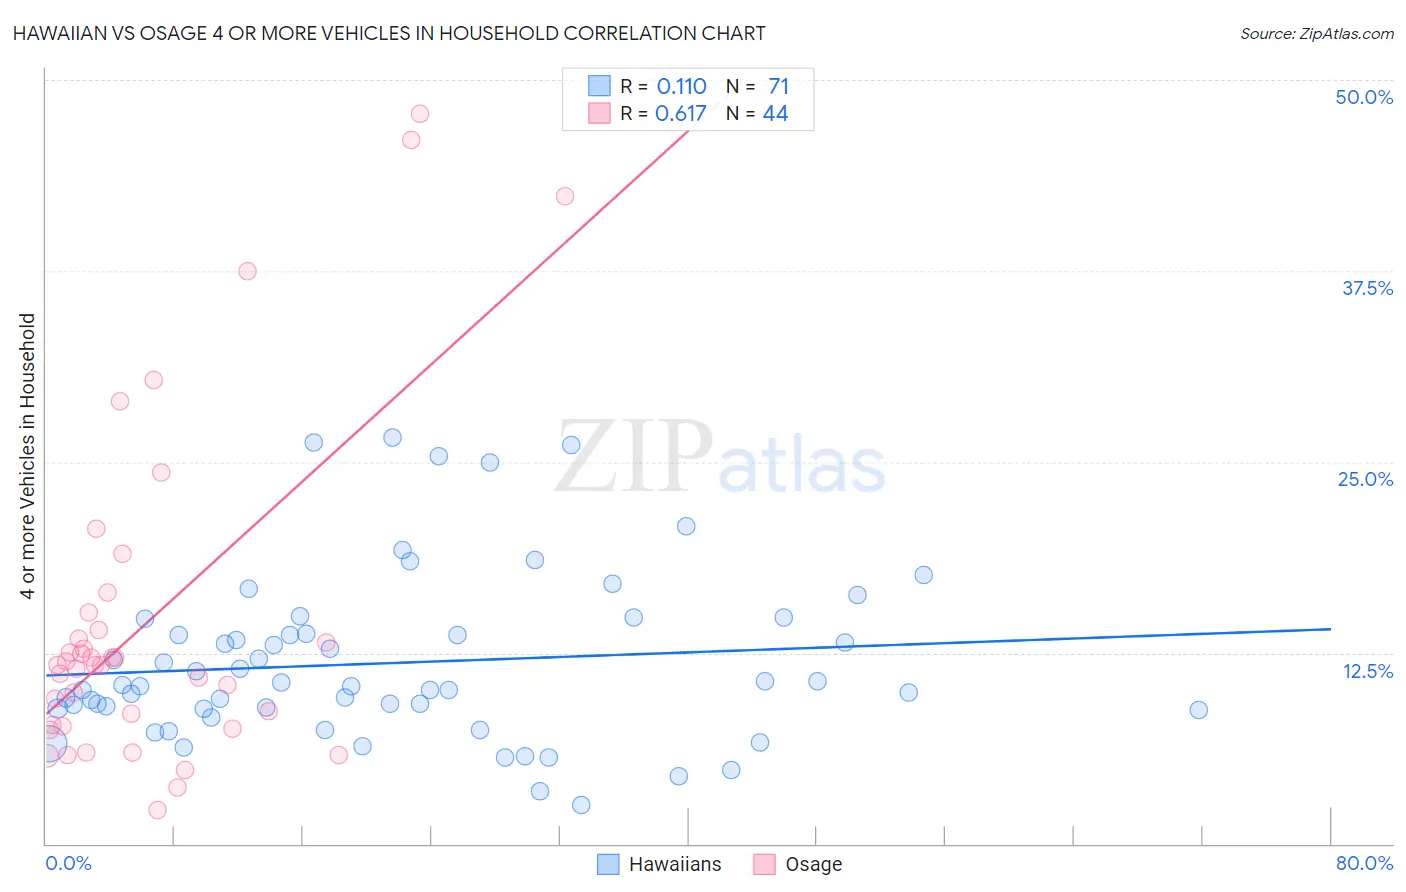
Hawaiian vs Osage 4 or more Vehicles in Household Correlation Chart
The statistical analysis conducted on geographies consisting of 326,237,649 people shows a poor positive correlation between the proportion of Hawaiians and percentage of households with 4 or more vehicles available in the United States with a correlation coefficient (R) of 0.110 and weighted average of 8.9%. Similarly, the statistical analysis conducted on geographies consisting of 91,747,496 people shows a significant positive correlation between the proportion of Osage and percentage of households with 4 or more vehicles available in the United States with a correlation coefficient (R) of 0.617 and weighted average of 7.8%, a difference of 15.0%.
4 or more Vehicles in Household Correlation Summary
| Measurement | Hawaiian | Osage |
| Minimum | 2.6% | 2.2% |
| Maximum | 26.6% | 47.8% |
| Range | 24.0% | 45.7% |
| Mean | 11.8% | 14.6% |
| Median | 10.3% | 11.7% |
| Interquartile 25% (IQ1) | 8.8% | 7.7% |
| Interquartile 75% (IQ3) | 13.7% | 14.6% |
| Interquartile Range (IQR) | 4.9% | 6.8% |
| Standard Deviation (Sample) | 5.4% | 11.0% |
| Standard Deviation (Population) | 5.4% | 10.9% |
Similar Demographics by 4 or more Vehicles in Household
Demographics Similar to Hawaiians by 4 or more Vehicles in Household
In terms of 4 or more vehicles in household, the demographic groups most similar to Hawaiians are Mexican (8.9%, a difference of 0.010%), Immigrants from Mexico (9.0%, a difference of 0.69%), Paiute (9.0%, a difference of 0.81%), Chinese (8.8%, a difference of 1.0%), and Shoshone (8.8%, a difference of 1.0%).
| Demographics | Rating | Rank | 4 or more Vehicles in Household |
| Puget Sound Salish | 100.0 /100 | #6 | Exceptional 9.4% |
| Native Hawaiians | 100.0 /100 | #7 | Exceptional 9.4% |
| Arapaho | 100.0 /100 | #8 | Exceptional 9.4% |
| Samoans | 100.0 /100 | #9 | Exceptional 9.2% |
| Paiute | 100.0 /100 | #10 | Exceptional 9.0% |
| Immigrants | Mexico | 100.0 /100 | #11 | Exceptional 9.0% |
| Mexicans | 100.0 /100 | #12 | Exceptional 8.9% |
| Hawaiians | 100.0 /100 | #13 | Exceptional 8.9% |
| Chinese | 100.0 /100 | #14 | Exceptional 8.8% |
| Shoshone | 100.0 /100 | #15 | Exceptional 8.8% |
| Lumbee | 100.0 /100 | #16 | Exceptional 8.8% |
| Ute | 100.0 /100 | #17 | Exceptional 8.8% |
| Nepalese | 100.0 /100 | #18 | Exceptional 8.7% |
| Koreans | 100.0 /100 | #19 | Exceptional 8.6% |
| Pueblo | 100.0 /100 | #20 | Exceptional 8.6% |
Demographics Similar to Osage by 4 or more Vehicles in Household
In terms of 4 or more vehicles in household, the demographic groups most similar to Osage are Crow (7.8%, a difference of 0.16%), Swiss (7.8%, a difference of 0.17%), Choctaw (7.8%, a difference of 0.33%), Cherokee (7.7%, a difference of 0.36%), and Bhutanese (7.8%, a difference of 0.38%).
| Demographics | Rating | Rank | 4 or more Vehicles in Household |
| Spanish | 100.0 /100 | #40 | Exceptional 7.9% |
| Pima | 100.0 /100 | #41 | Exceptional 7.9% |
| Salvadorans | 100.0 /100 | #42 | Exceptional 7.8% |
| Fijians | 100.0 /100 | #43 | Exceptional 7.8% |
| Bhutanese | 100.0 /100 | #44 | Exceptional 7.8% |
| Choctaw | 100.0 /100 | #45 | Exceptional 7.8% |
| Crow | 100.0 /100 | #46 | Exceptional 7.8% |
| Osage | 100.0 /100 | #47 | Exceptional 7.8% |
| Swiss | 100.0 /100 | #48 | Exceptional 7.8% |
| Cherokee | 100.0 /100 | #49 | Exceptional 7.7% |
| Immigrants | El Salvador | 100.0 /100 | #50 | Exceptional 7.7% |
| Immigrants | Laos | 100.0 /100 | #51 | Exceptional 7.7% |
| Japanese | 100.0 /100 | #52 | Exceptional 7.7% |
| Malaysians | 100.0 /100 | #53 | Exceptional 7.7% |
| Dutch | 100.0 /100 | #54 | Exceptional 7.7% |