Bahamian vs Immigrants from Brazil 4 or more Vehicles in Household
COMPARE
Bahamian
Immigrants from Brazil
4 or more Vehicles in Household
4 or more Vehicles in Household Comparison
Bahamians
Immigrants from Brazil
5.1%
4 OR MORE VEHICLES IN HOUSEHOLD
0.0/ 100
METRIC RATING
302nd/ 347
METRIC RANK
5.2%
4 OR MORE VEHICLES IN HOUSEHOLD
0.1/ 100
METRIC RATING
295th/ 347
METRIC RANK
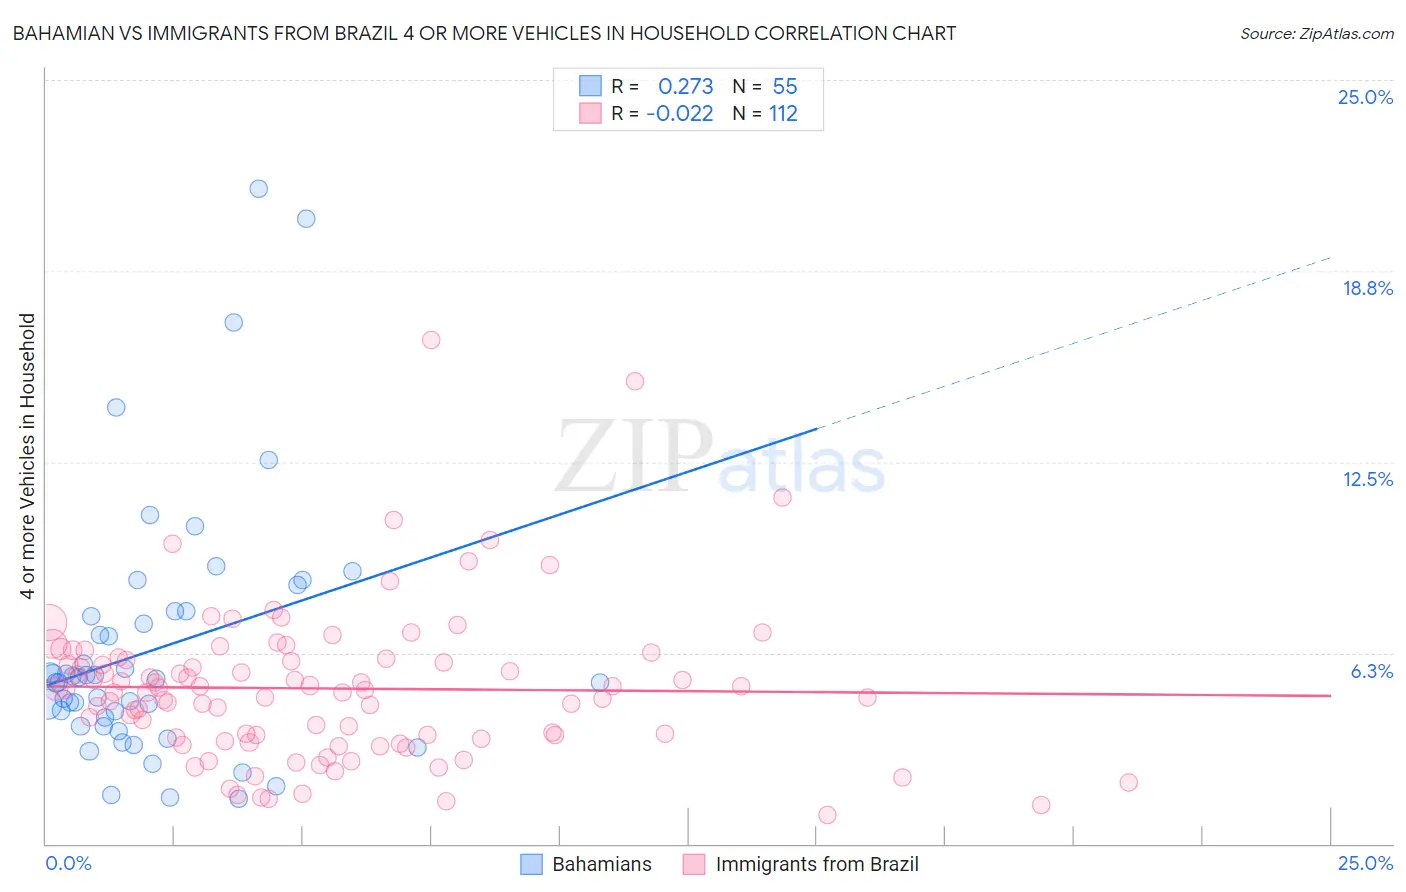
Bahamian vs Immigrants from Brazil 4 or more Vehicles in Household Correlation Chart
The statistical analysis conducted on geographies consisting of 112,347,492 people shows a weak positive correlation between the proportion of Bahamians and percentage of households with 4 or more vehicles available in the United States with a correlation coefficient (R) of 0.273 and weighted average of 5.1%. Similarly, the statistical analysis conducted on geographies consisting of 341,468,936 people shows no correlation between the proportion of Immigrants from Brazil and percentage of households with 4 or more vehicles available in the United States with a correlation coefficient (R) of -0.022 and weighted average of 5.2%, a difference of 3.2%.
4 or more Vehicles in Household Correlation Summary
| Measurement | Bahamian | Immigrants from Brazil |
| Minimum | 1.5% | 0.95% |
| Maximum | 21.5% | 16.5% |
| Range | 20.0% | 15.6% |
| Mean | 6.4% | 5.1% |
| Median | 5.4% | 5.0% |
| Interquartile 25% (IQ1) | 3.9% | 3.5% |
| Interquartile 75% (IQ3) | 7.6% | 6.0% |
| Interquartile Range (IQR) | 3.7% | 2.6% |
| Standard Deviation (Sample) | 4.2% | 2.5% |
| Standard Deviation (Population) | 4.1% | 2.5% |
Demographics Similar to Bahamians and Immigrants from Brazil by 4 or more Vehicles in Household
In terms of 4 or more vehicles in household, the demographic groups most similar to Bahamians are Immigrants from Zaire (5.1%, a difference of 0.31%), Immigrants from Morocco (5.1%, a difference of 0.39%), Immigrants from Greece (5.1%, a difference of 0.47%), Cypriot (5.0%, a difference of 1.0%), and Somali (5.0%, a difference of 1.0%). Similarly, the demographic groups most similar to Immigrants from Brazil are Ghanaian (5.2%, a difference of 0.11%), Immigrants from Congo (5.2%, a difference of 0.17%), Israeli (5.2%, a difference of 0.18%), Liberian (5.3%, a difference of 0.20%), and Immigrants from Bahamas (5.3%, a difference of 0.30%).
| Demographics | Rating | Rank | 4 or more Vehicles in Household |
| Venezuelans | 0.2 /100 | #288 | Tragic 5.3% |
| Immigrants | Bosnia and Herzegovina | 0.2 /100 | #289 | Tragic 5.3% |
| Immigrants | Russia | 0.2 /100 | #290 | Tragic 5.3% |
| Immigrants | Bahamas | 0.1 /100 | #291 | Tragic 5.3% |
| Liberians | 0.1 /100 | #292 | Tragic 5.3% |
| Immigrants | Congo | 0.1 /100 | #293 | Tragic 5.2% |
| Ghanaians | 0.1 /100 | #294 | Tragic 5.2% |
| Immigrants | Brazil | 0.1 /100 | #295 | Tragic 5.2% |
| Israelis | 0.1 /100 | #296 | Tragic 5.2% |
| Immigrants | Venezuela | 0.1 /100 | #297 | Tragic 5.2% |
| Immigrants | South America | 0.1 /100 | #298 | Tragic 5.2% |
| Immigrants | Ghana | 0.1 /100 | #299 | Tragic 5.2% |
| Immigrants | Morocco | 0.0 /100 | #300 | Tragic 5.1% |
| Immigrants | Zaire | 0.0 /100 | #301 | Tragic 5.1% |
| Bahamians | 0.0 /100 | #302 | Tragic 5.1% |
| Immigrants | Greece | 0.0 /100 | #303 | Tragic 5.1% |
| Cypriots | 0.0 /100 | #304 | Tragic 5.0% |
| Somalis | 0.0 /100 | #305 | Tragic 5.0% |
| Immigrants | Serbia | 0.0 /100 | #306 | Tragic 5.0% |
| Menominee | 0.0 /100 | #307 | Tragic 5.0% |
| Paraguayans | 0.0 /100 | #308 | Tragic 4.9% |