Armenian vs Scottish 2 or more Vehicles in Household
COMPARE
Armenian
Scottish
2 or more Vehicles in Household
2 or more Vehicles in Household Comparison
Armenians
Scottish
56.3%
2 OR MORE VEHICLES IN HOUSEHOLD
84.3/ 100
METRIC RATING
139th/ 347
METRIC RANK
61.2%
2 OR MORE VEHICLES IN HOUSEHOLD
100.0/ 100
METRIC RATING
19th/ 347
METRIC RANK
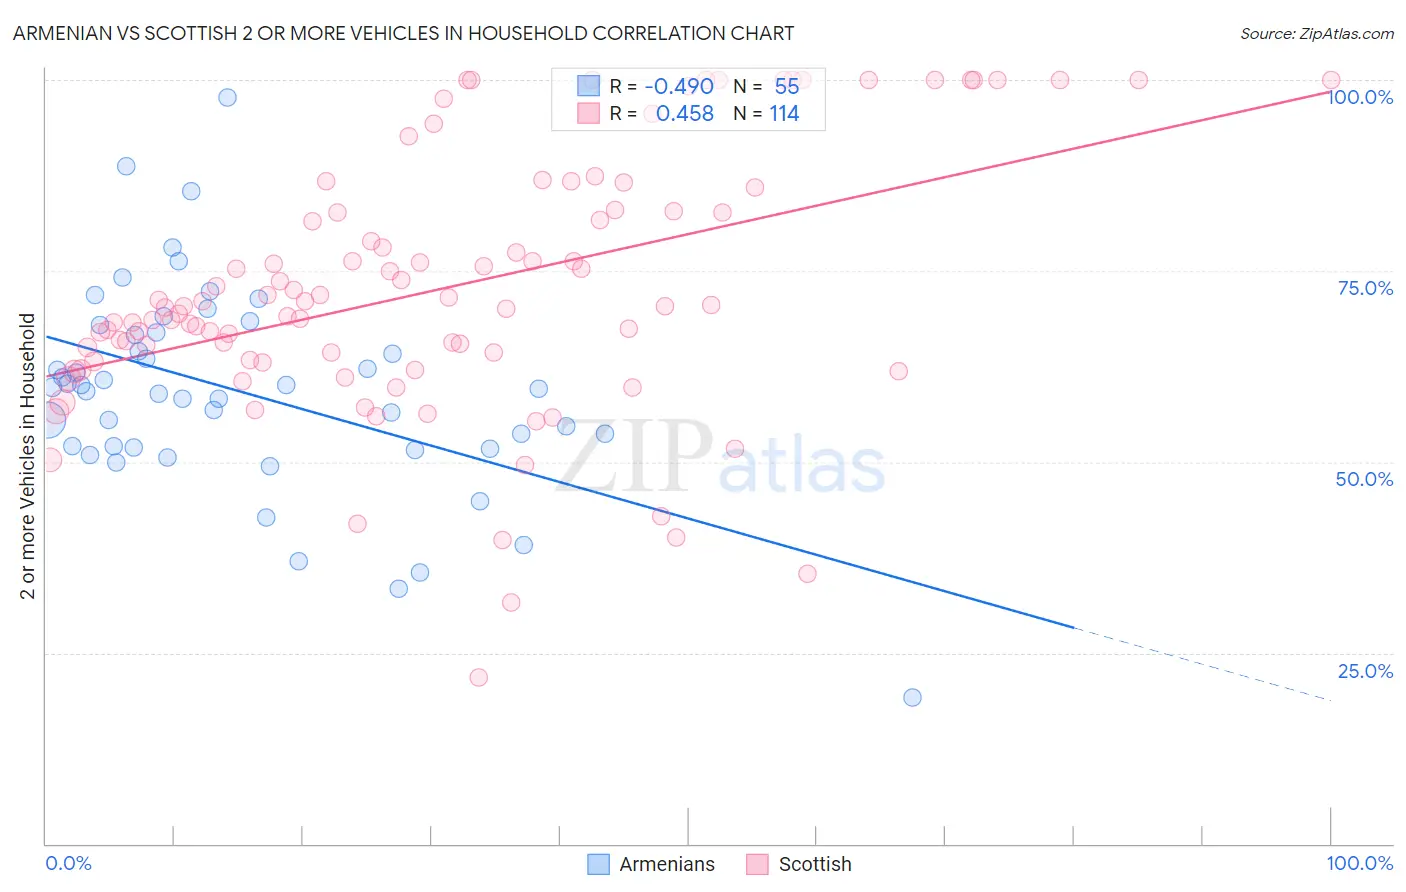
Armenian vs Scottish 2 or more Vehicles in Household Correlation Chart
The statistical analysis conducted on geographies consisting of 310,821,659 people shows a moderate negative correlation between the proportion of Armenians and percentage of households with 2 or more vehicles available in the United States with a correlation coefficient (R) of -0.490 and weighted average of 56.3%. Similarly, the statistical analysis conducted on geographies consisting of 566,626,490 people shows a moderate positive correlation between the proportion of Scottish and percentage of households with 2 or more vehicles available in the United States with a correlation coefficient (R) of 0.458 and weighted average of 61.2%, a difference of 8.8%.
2 or more Vehicles in Household Correlation Summary
| Measurement | Armenian | Scottish |
| Minimum | 19.2% | 21.7% |
| Maximum | 97.7% | 100.0% |
| Range | 78.5% | 78.3% |
| Mean | 59.2% | 72.7% |
| Median | 59.5% | 70.5% |
| Interquartile 25% (IQ1) | 51.9% | 63.2% |
| Interquartile 75% (IQ3) | 67.0% | 82.8% |
| Interquartile Range (IQR) | 15.1% | 19.6% |
| Standard Deviation (Sample) | 13.6% | 16.9% |
| Standard Deviation (Population) | 13.4% | 16.8% |
Similar Demographics by 2 or more Vehicles in Household
Demographics Similar to Armenians by 2 or more Vehicles in Household
In terms of 2 or more vehicles in household, the demographic groups most similar to Armenians are Salvadoran (56.3%, a difference of 0.030%), Cuban (56.3%, a difference of 0.040%), Latvian (56.2%, a difference of 0.050%), Immigrants from Cambodia (56.2%, a difference of 0.050%), and South African (56.2%, a difference of 0.090%).
| Demographics | Rating | Rank | 2 or more Vehicles in Household |
| Hungarians | 89.1 /100 | #132 | Excellent 56.5% |
| Comanche | 88.4 /100 | #133 | Excellent 56.5% |
| Immigrants | Azores | 86.6 /100 | #134 | Excellent 56.4% |
| Blackfeet | 86.5 /100 | #135 | Excellent 56.4% |
| Immigrants | Asia | 86.0 /100 | #136 | Excellent 56.3% |
| Cubans | 84.8 /100 | #137 | Excellent 56.3% |
| Salvadorans | 84.7 /100 | #138 | Excellent 56.3% |
| Armenians | 84.3 /100 | #139 | Excellent 56.3% |
| Latvians | 83.6 /100 | #140 | Excellent 56.2% |
| Immigrants | Cambodia | 83.6 /100 | #141 | Excellent 56.2% |
| South Africans | 83.1 /100 | #142 | Excellent 56.2% |
| Seminole | 81.7 /100 | #143 | Excellent 56.2% |
| Immigrants | Syria | 81.4 /100 | #144 | Excellent 56.2% |
| Syrians | 81.2 /100 | #145 | Excellent 56.2% |
| Venezuelans | 80.7 /100 | #146 | Excellent 56.1% |
Demographics Similar to Scottish by 2 or more Vehicles in Household
In terms of 2 or more vehicles in household, the demographic groups most similar to Scottish are European (61.4%, a difference of 0.20%), Basque (61.4%, a difference of 0.22%), Native Hawaiian (61.4%, a difference of 0.28%), Nepalese (61.4%, a difference of 0.31%), and Sri Lankan (61.0%, a difference of 0.35%).
| Demographics | Rating | Rank | 2 or more Vehicles in Household |
| Germans | 100.0 /100 | #12 | Exceptional 61.6% |
| Samoans | 100.0 /100 | #13 | Exceptional 61.5% |
| Czechs | 100.0 /100 | #14 | Exceptional 61.5% |
| Nepalese | 100.0 /100 | #15 | Exceptional 61.4% |
| Native Hawaiians | 100.0 /100 | #16 | Exceptional 61.4% |
| Basques | 100.0 /100 | #17 | Exceptional 61.4% |
| Europeans | 100.0 /100 | #18 | Exceptional 61.4% |
| Scottish | 100.0 /100 | #19 | Exceptional 61.2% |
| Sri Lankans | 100.0 /100 | #20 | Exceptional 61.0% |
| Koreans | 100.0 /100 | #21 | Exceptional 61.0% |
| Swiss | 100.0 /100 | #22 | Exceptional 61.0% |
| Scotch-Irish | 100.0 /100 | #23 | Exceptional 60.9% |
| Immigrants | Vietnam | 100.0 /100 | #24 | Exceptional 60.9% |
| Whites/Caucasians | 100.0 /100 | #25 | Exceptional 60.8% |
| Welsh | 100.0 /100 | #26 | Exceptional 60.8% |