Apache vs Jamaican College, Under 1 year
COMPARE
Apache
Jamaican
College, Under 1 year
College, Under 1 year Comparison
Apache
Jamaicans
58.0%
COLLEGE, UNDER 1 YEAR
0.0/ 100
METRIC RATING
302nd/ 347
METRIC RANK
60.5%
COLLEGE, UNDER 1 YEAR
0.1/ 100
METRIC RATING
272nd/ 347
METRIC RANK
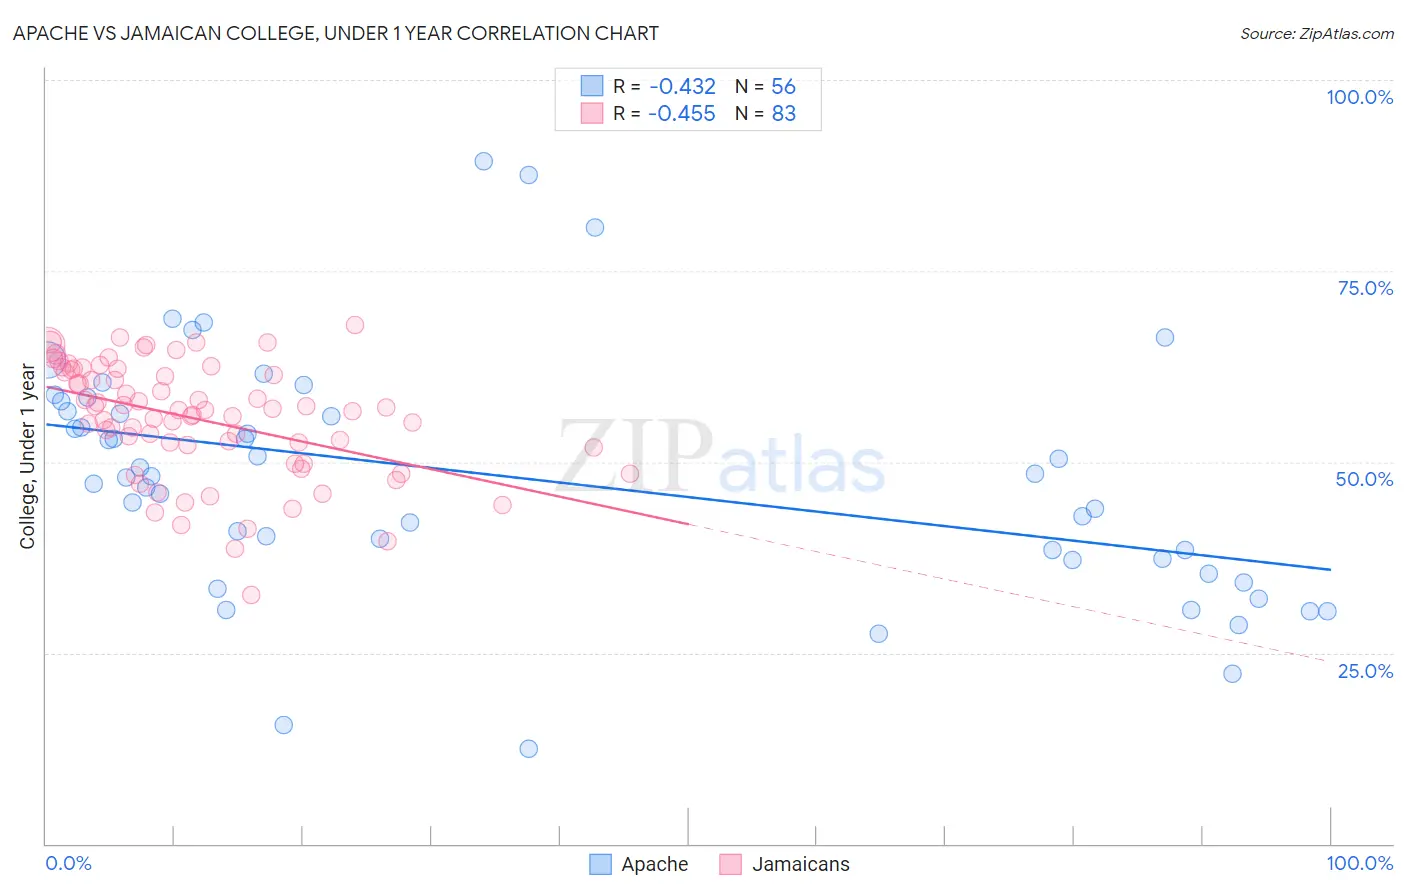
Apache vs Jamaican College, Under 1 year Correlation Chart
The statistical analysis conducted on geographies consisting of 231,142,948 people shows a moderate negative correlation between the proportion of Apache and percentage of population with at least college, under 1 year education in the United States with a correlation coefficient (R) of -0.432 and weighted average of 58.0%. Similarly, the statistical analysis conducted on geographies consisting of 368,078,751 people shows a moderate negative correlation between the proportion of Jamaicans and percentage of population with at least college, under 1 year education in the United States with a correlation coefficient (R) of -0.455 and weighted average of 60.5%, a difference of 4.2%.
College, Under 1 year Correlation Summary
| Measurement | Apache | Jamaican |
| Minimum | 12.5% | 32.5% |
| Maximum | 89.3% | 68.0% |
| Range | 76.8% | 35.5% |
| Mean | 47.9% | 55.6% |
| Median | 48.0% | 56.7% |
| Interquartile 25% (IQ1) | 37.3% | 51.9% |
| Interquartile 75% (IQ3) | 57.3% | 62.0% |
| Interquartile Range (IQR) | 20.1% | 10.1% |
| Standard Deviation (Sample) | 15.9% | 7.5% |
| Standard Deviation (Population) | 15.7% | 7.4% |
Similar Demographics by College, Under 1 year
Demographics Similar to Apache by College, Under 1 year
In terms of college, under 1 year, the demographic groups most similar to Apache are Mexican American Indian (58.1%, a difference of 0.19%), Immigrants from Dominica (57.9%, a difference of 0.29%), Kiowa (57.8%, a difference of 0.30%), Haitian (57.8%, a difference of 0.42%), and Immigrants from Portugal (57.7%, a difference of 0.62%).
| Demographics | Rating | Rank | College, Under 1 year |
| Immigrants | Grenada | 0.0 /100 | #295 | Tragic 59.1% |
| Central American Indians | 0.0 /100 | #296 | Tragic 59.0% |
| Guyanese | 0.0 /100 | #297 | Tragic 59.0% |
| Immigrants | Ecuador | 0.0 /100 | #298 | Tragic 58.7% |
| Cubans | 0.0 /100 | #299 | Tragic 58.6% |
| Immigrants | Guyana | 0.0 /100 | #300 | Tragic 58.5% |
| Mexican American Indians | 0.0 /100 | #301 | Tragic 58.1% |
| Apache | 0.0 /100 | #302 | Tragic 58.0% |
| Immigrants | Dominica | 0.0 /100 | #303 | Tragic 57.9% |
| Kiowa | 0.0 /100 | #304 | Tragic 57.8% |
| Haitians | 0.0 /100 | #305 | Tragic 57.8% |
| Immigrants | Portugal | 0.0 /100 | #306 | Tragic 57.7% |
| Fijians | 0.0 /100 | #307 | Tragic 57.7% |
| Central Americans | 0.0 /100 | #308 | Tragic 57.7% |
| Immigrants | Nicaragua | 0.0 /100 | #309 | Tragic 57.6% |
Demographics Similar to Jamaicans by College, Under 1 year
In terms of college, under 1 year, the demographic groups most similar to Jamaicans are Chickasaw (60.4%, a difference of 0.050%), Alaska Native (60.4%, a difference of 0.050%), U.S. Virgin Islander (60.6%, a difference of 0.16%), Cheyenne (60.6%, a difference of 0.17%), and Immigrants from Barbados (60.4%, a difference of 0.18%).
| Demographics | Rating | Rank | College, Under 1 year |
| Immigrants | Bahamas | 0.2 /100 | #265 | Tragic 61.1% |
| Alaskan Athabascans | 0.2 /100 | #266 | Tragic 61.0% |
| Americans | 0.2 /100 | #267 | Tragic 61.0% |
| Immigrants | Trinidad and Tobago | 0.1 /100 | #268 | Tragic 60.7% |
| Immigrants | West Indies | 0.1 /100 | #269 | Tragic 60.6% |
| Cheyenne | 0.1 /100 | #270 | Tragic 60.6% |
| U.S. Virgin Islanders | 0.1 /100 | #271 | Tragic 60.6% |
| Jamaicans | 0.1 /100 | #272 | Tragic 60.5% |
| Chickasaw | 0.1 /100 | #273 | Tragic 60.4% |
| Alaska Natives | 0.1 /100 | #274 | Tragic 60.4% |
| Immigrants | Barbados | 0.1 /100 | #275 | Tragic 60.4% |
| Arapaho | 0.1 /100 | #276 | Tragic 60.3% |
| Bahamians | 0.1 /100 | #277 | Tragic 60.3% |
| Yaqui | 0.1 /100 | #278 | Tragic 60.2% |
| Ute | 0.1 /100 | #279 | Tragic 60.2% |