Aleut vs Iroquois Householder Income Ages 45 - 64 years
COMPARE
Aleut
Iroquois
Householder Income Ages 45 - 64 years
Householder Income Ages 45 - 64 years Comparison
Aleuts
Iroquois
$100,052
HOUSEHOLDER INCOME AGES 45 - 64 YEARS
46.6/ 100
METRIC RATING
180th/ 347
METRIC RANK
$87,255
HOUSEHOLDER INCOME AGES 45 - 64 YEARS
0.1/ 100
METRIC RATING
274th/ 347
METRIC RANK
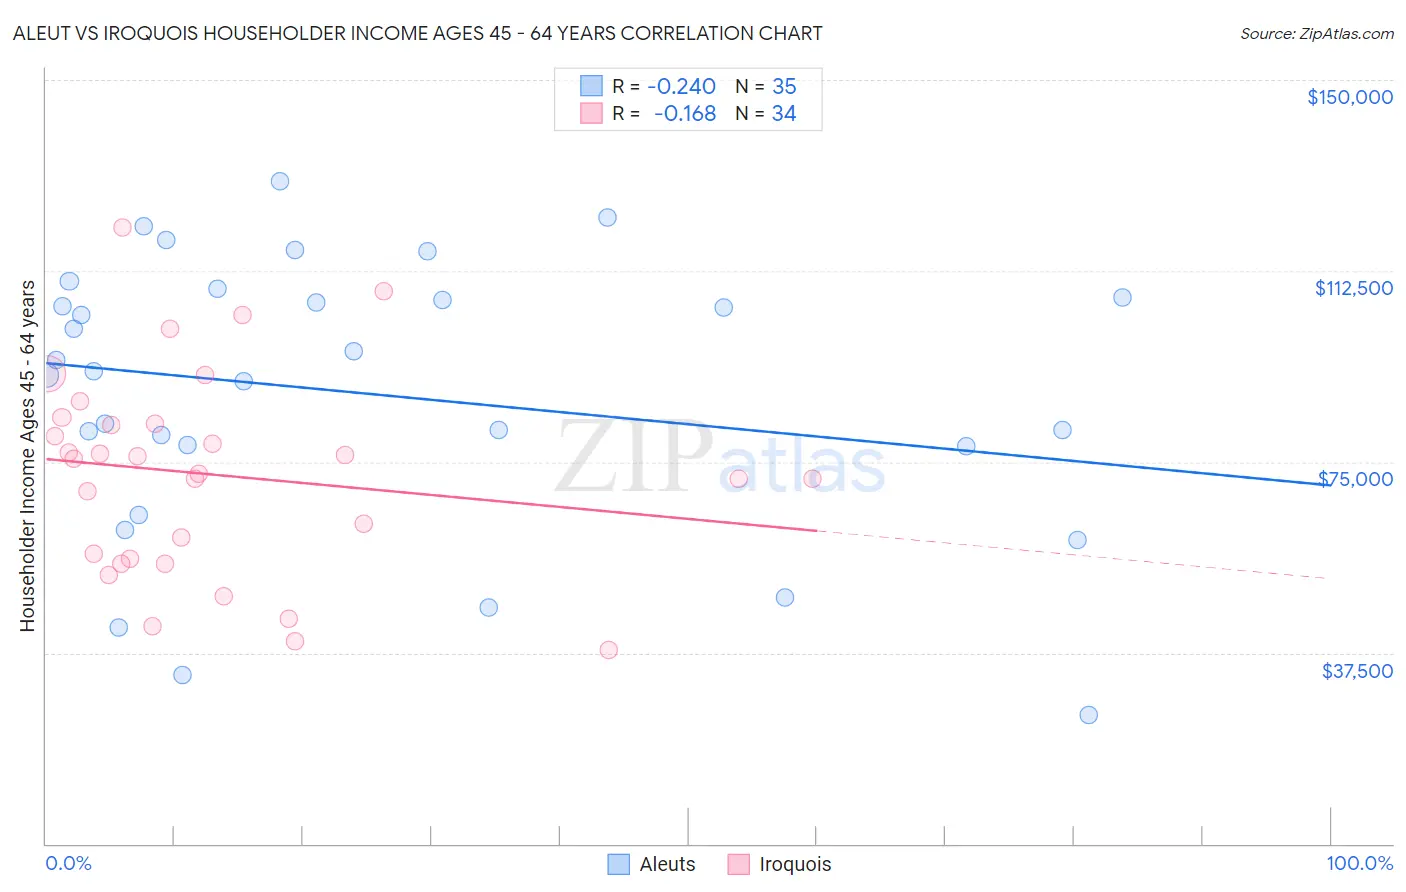
Aleut vs Iroquois Householder Income Ages 45 - 64 years Correlation Chart
The statistical analysis conducted on geographies consisting of 61,745,960 people shows a weak negative correlation between the proportion of Aleuts and household income with householder between the ages 45 and 64 in the United States with a correlation coefficient (R) of -0.240 and weighted average of $100,052. Similarly, the statistical analysis conducted on geographies consisting of 207,070,070 people shows a poor negative correlation between the proportion of Iroquois and household income with householder between the ages 45 and 64 in the United States with a correlation coefficient (R) of -0.168 and weighted average of $87,255, a difference of 14.7%.
Householder Income Ages 45 - 64 years Correlation Summary
| Measurement | Aleut | Iroquois |
| Minimum | $25,250 | $38,056 |
| Maximum | $130,063 | $121,151 |
| Range | $104,813 | $83,095 |
| Mean | $88,376 | $72,442 |
| Median | $92,906 | $74,085 |
| Interquartile 25% (IQ1) | $78,125 | $55,882 |
| Interquartile 75% (IQ3) | $107,188 | $82,434 |
| Interquartile Range (IQR) | $29,063 | $26,552 |
| Standard Deviation (Sample) | $26,902 | $20,014 |
| Standard Deviation (Population) | $26,515 | $19,717 |
Similar Demographics by Householder Income Ages 45 - 64 years
Demographics Similar to Aleuts by Householder Income Ages 45 - 64 years
In terms of householder income ages 45 - 64 years, the demographic groups most similar to Aleuts are Belgian ($100,060, a difference of 0.010%), Immigrants from Cameroon ($100,084, a difference of 0.030%), Immigrants from Costa Rica ($100,141, a difference of 0.090%), Moroccan ($100,138, a difference of 0.090%), and Immigrants ($99,943, a difference of 0.11%).
| Demographics | Rating | Rank | Householder Income Ages 45 - 64 years |
| Alsatians | 51.4 /100 | #173 | Average $100,435 |
| Welsh | 50.0 /100 | #174 | Average $100,322 |
| Germans | 48.8 /100 | #175 | Average $100,224 |
| Immigrants | Costa Rica | 47.7 /100 | #176 | Average $100,141 |
| Moroccans | 47.7 /100 | #177 | Average $100,138 |
| Immigrants | Cameroon | 47.0 /100 | #178 | Average $100,084 |
| Belgians | 46.7 /100 | #179 | Average $100,060 |
| Aleuts | 46.6 /100 | #180 | Average $100,052 |
| Immigrants | Immigrants | 45.3 /100 | #181 | Average $99,943 |
| Finns | 44.8 /100 | #182 | Average $99,904 |
| Spaniards | 44.6 /100 | #183 | Average $99,889 |
| French | 43.8 /100 | #184 | Average $99,824 |
| Colombians | 43.2 /100 | #185 | Average $99,772 |
| Dutch | 41.7 /100 | #186 | Average $99,650 |
| Iraqis | 38.5 /100 | #187 | Fair $99,387 |
Demographics Similar to Iroquois by Householder Income Ages 45 - 64 years
In terms of householder income ages 45 - 64 years, the demographic groups most similar to Iroquois are Immigrants from Belize ($87,229, a difference of 0.030%), Immigrants from Latin America ($87,219, a difference of 0.040%), Cree ($87,185, a difference of 0.080%), Immigrants from Jamaica ($87,035, a difference of 0.25%), and Yakama ($86,992, a difference of 0.30%).
| Demographics | Rating | Rank | Householder Income Ages 45 - 64 years |
| Hmong | 0.2 /100 | #267 | Tragic $88,115 |
| Immigrants | Micronesia | 0.2 /100 | #268 | Tragic $87,864 |
| Spanish Americans | 0.2 /100 | #269 | Tragic $87,836 |
| Immigrants | Liberia | 0.2 /100 | #270 | Tragic $87,739 |
| Guatemalans | 0.2 /100 | #271 | Tragic $87,705 |
| Cape Verdeans | 0.2 /100 | #272 | Tragic $87,580 |
| Spanish American Indians | 0.2 /100 | #273 | Tragic $87,561 |
| Iroquois | 0.1 /100 | #274 | Tragic $87,255 |
| Immigrants | Belize | 0.1 /100 | #275 | Tragic $87,229 |
| Immigrants | Latin America | 0.1 /100 | #276 | Tragic $87,219 |
| Cree | 0.1 /100 | #277 | Tragic $87,185 |
| Immigrants | Jamaica | 0.1 /100 | #278 | Tragic $87,035 |
| Yakama | 0.1 /100 | #279 | Tragic $86,992 |
| Immigrants | Somalia | 0.1 /100 | #280 | Tragic $86,987 |
| Yaqui | 0.1 /100 | #281 | Tragic $86,914 |