Immigrants from Zaire vs Iroquois 1 or more Vehicles in Household
COMPARE
Immigrants from Zaire
Iroquois
1 or more Vehicles in Household
1 or more Vehicles in Household Comparison
Immigrants from Zaire
Iroquois
88.8%
1 OR MORE VEHICLES IN HOUSEHOLD
8.1/ 100
METRIC RATING
220th/ 347
METRIC RANK
89.2%
1 OR MORE VEHICLES IN HOUSEHOLD
19.8/ 100
METRIC RATING
202nd/ 347
METRIC RANK
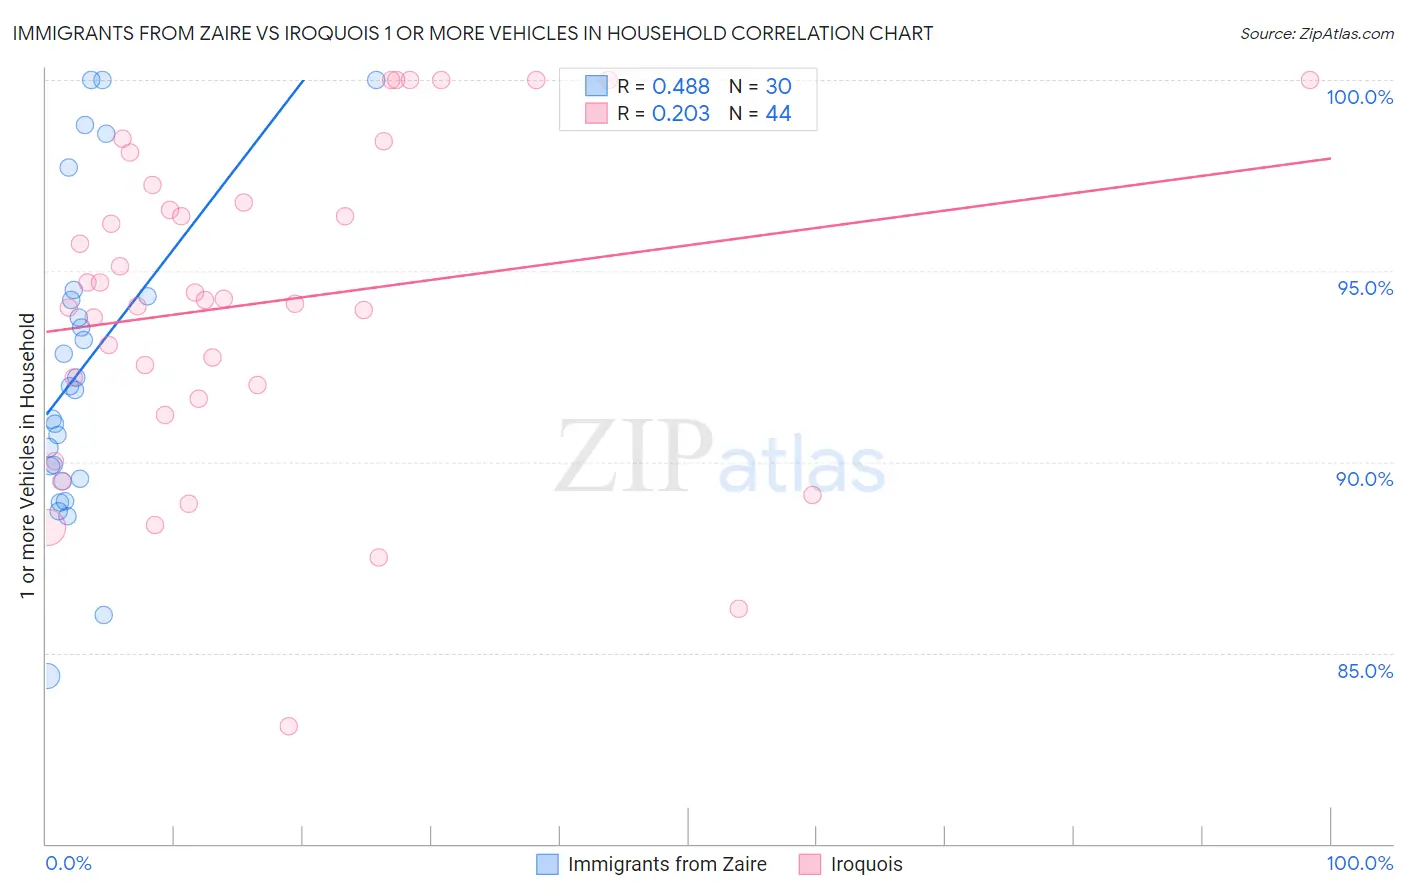
Immigrants from Zaire vs Iroquois 1 or more Vehicles in Household Correlation Chart
The statistical analysis conducted on geographies consisting of 107,246,664 people shows a moderate positive correlation between the proportion of Immigrants from Zaire and percentage of households with 1 or more vehicles available in the United States with a correlation coefficient (R) of 0.488 and weighted average of 88.8%. Similarly, the statistical analysis conducted on geographies consisting of 207,261,680 people shows a weak positive correlation between the proportion of Iroquois and percentage of households with 1 or more vehicles available in the United States with a correlation coefficient (R) of 0.203 and weighted average of 89.2%, a difference of 0.40%.
1 or more Vehicles in Household Correlation Summary
| Measurement | Immigrants from Zaire | Iroquois |
| Minimum | 84.4% | 83.1% |
| Maximum | 100.0% | 100.0% |
| Range | 15.6% | 16.9% |
| Mean | 92.5% | 94.2% |
| Median | 91.9% | 94.2% |
| Interquartile 25% (IQ1) | 89.6% | 91.8% |
| Interquartile 75% (IQ3) | 94.4% | 97.0% |
| Interquartile Range (IQR) | 4.8% | 5.2% |
| Standard Deviation (Sample) | 4.1% | 4.2% |
| Standard Deviation (Population) | 4.1% | 4.1% |
Demographics Similar to Immigrants from Zaire and Iroquois by 1 or more Vehicles in Household
In terms of 1 or more vehicles in household, the demographic groups most similar to Immigrants from Zaire are Peruvian (88.8%, a difference of 0.010%), Ugandan (88.9%, a difference of 0.030%), Immigrants from Guatemala (88.9%, a difference of 0.030%), Argentinean (88.9%, a difference of 0.040%), and Immigrants from Argentina (88.9%, a difference of 0.070%). Similarly, the demographic groups most similar to Iroquois are Immigrants from Western Europe (89.2%, a difference of 0.020%), Cambodian (89.2%, a difference of 0.020%), Romanian (89.2%, a difference of 0.040%), Guatemalan (89.2%, a difference of 0.050%), and Apache (89.1%, a difference of 0.10%).
| Demographics | Rating | Rank | 1 or more Vehicles in Household |
| Immigrants | Western Europe | 20.5 /100 | #201 | Fair 89.2% |
| Iroquois | 19.8 /100 | #202 | Poor 89.2% |
| Cambodians | 18.9 /100 | #203 | Poor 89.2% |
| Romanians | 18.2 /100 | #204 | Poor 89.2% |
| Guatemalans | 17.8 /100 | #205 | Poor 89.2% |
| Apache | 16.2 /100 | #206 | Poor 89.1% |
| Immigrants | Denmark | 14.8 /100 | #207 | Poor 89.1% |
| Immigrants | Chile | 14.4 /100 | #208 | Poor 89.1% |
| Immigrants | Italy | 14.0 /100 | #209 | Poor 89.1% |
| Dutch West Indians | 13.5 /100 | #210 | Poor 89.0% |
| Sierra Leoneans | 13.0 /100 | #211 | Poor 89.0% |
| Somalis | 12.8 /100 | #212 | Poor 89.0% |
| Immigrants | Western Asia | 12.3 /100 | #213 | Poor 89.0% |
| Immigrants | Hungary | 11.9 /100 | #214 | Poor 89.0% |
| Immigrants | Sri Lanka | 10.2 /100 | #215 | Poor 88.9% |
| Immigrants | Argentina | 9.4 /100 | #216 | Tragic 88.9% |
| Argentineans | 8.8 /100 | #217 | Tragic 88.9% |
| Ugandans | 8.7 /100 | #218 | Tragic 88.9% |
| Immigrants | Guatemala | 8.6 /100 | #219 | Tragic 88.9% |
| Immigrants | Zaire | 8.1 /100 | #220 | Tragic 88.8% |
| Peruvians | 7.9 /100 | #221 | Tragic 88.8% |