Aleut vs Iroquois In Labor Force | Age 20-64
COMPARE
Aleut
Iroquois
In Labor Force | Age 20-64
In Labor Force | Age 20-64 Comparison
Aleuts
Iroquois
78.2%
IN LABOR FORCE | AGE 20-64
0.0/ 100
METRIC RATING
274th/ 347
METRIC RANK
77.5%
IN LABOR FORCE | AGE 20-64
0.0/ 100
METRIC RATING
302nd/ 347
METRIC RANK
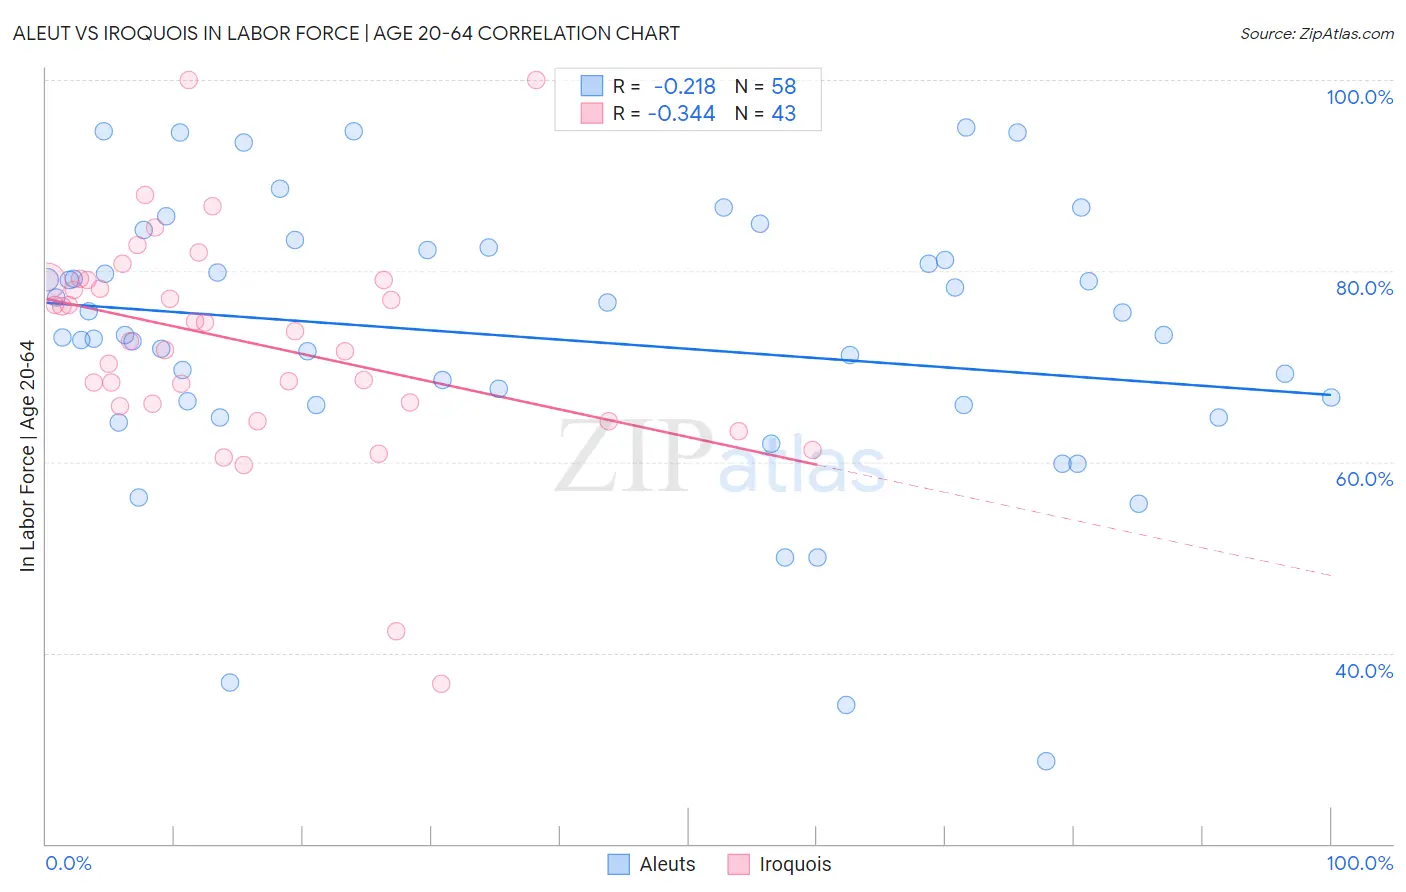
Aleut vs Iroquois In Labor Force | Age 20-64 Correlation Chart
The statistical analysis conducted on geographies consisting of 61,782,784 people shows a weak negative correlation between the proportion of Aleuts and labor force participation rate among population between the ages 20 and 64 in the United States with a correlation coefficient (R) of -0.218 and weighted average of 78.2%. Similarly, the statistical analysis conducted on geographies consisting of 207,293,239 people shows a mild negative correlation between the proportion of Iroquois and labor force participation rate among population between the ages 20 and 64 in the United States with a correlation coefficient (R) of -0.344 and weighted average of 77.5%, a difference of 0.94%.
In Labor Force | Age 20-64 Correlation Summary
| Measurement | Aleut | Iroquois |
| Minimum | 28.6% | 36.8% |
| Maximum | 95.0% | 100.0% |
| Range | 66.4% | 63.2% |
| Mean | 73.0% | 72.6% |
| Median | 73.3% | 73.7% |
| Interquartile 25% (IQ1) | 66.0% | 66.1% |
| Interquartile 75% (IQ3) | 82.2% | 79.0% |
| Interquartile Range (IQR) | 16.2% | 12.9% |
| Standard Deviation (Sample) | 14.4% | 11.8% |
| Standard Deviation (Population) | 14.3% | 11.7% |
Similar Demographics by In Labor Force | Age 20-64
Demographics Similar to Aleuts by In Labor Force | Age 20-64
In terms of in labor force | age 20-64, the demographic groups most similar to Aleuts are Spanish (78.2%, a difference of 0.010%), Puget Sound Salish (78.2%, a difference of 0.010%), French American Indian (78.2%, a difference of 0.020%), Immigrants from Bahamas (78.2%, a difference of 0.020%), and Mexican American Indian (78.2%, a difference of 0.030%).
| Demographics | Rating | Rank | In Labor Force | Age 20-64 |
| U.S. Virgin Islanders | 0.1 /100 | #267 | Tragic 78.4% |
| West Indians | 0.0 /100 | #268 | Tragic 78.3% |
| Immigrants | Barbados | 0.0 /100 | #269 | Tragic 78.3% |
| Scotch-Irish | 0.0 /100 | #270 | Tragic 78.3% |
| Immigrants | Latin America | 0.0 /100 | #271 | Tragic 78.3% |
| Marshallese | 0.0 /100 | #272 | Tragic 78.3% |
| French American Indians | 0.0 /100 | #273 | Tragic 78.2% |
| Aleuts | 0.0 /100 | #274 | Tragic 78.2% |
| Spanish | 0.0 /100 | #275 | Tragic 78.2% |
| Puget Sound Salish | 0.0 /100 | #276 | Tragic 78.2% |
| Immigrants | Bahamas | 0.0 /100 | #277 | Tragic 78.2% |
| Mexican American Indians | 0.0 /100 | #278 | Tragic 78.2% |
| Belizeans | 0.0 /100 | #279 | Tragic 78.2% |
| Immigrants | Dominica | 0.0 /100 | #280 | Tragic 78.1% |
| Guyanese | 0.0 /100 | #281 | Tragic 78.1% |
Demographics Similar to Iroquois by In Labor Force | Age 20-64
In terms of in labor force | age 20-64, the demographic groups most similar to Iroquois are Nepalese (77.5%, a difference of 0.050%), Spanish American Indian (77.6%, a difference of 0.090%), Hispanic or Latino (77.6%, a difference of 0.16%), Dominican (77.7%, a difference of 0.22%), and Cree (77.7%, a difference of 0.22%).
| Demographics | Rating | Rank | In Labor Force | Age 20-64 |
| Immigrants | Grenada | 0.0 /100 | #295 | Tragic 77.7% |
| Immigrants | Dominican Republic | 0.0 /100 | #296 | Tragic 77.7% |
| Dominicans | 0.0 /100 | #297 | Tragic 77.7% |
| Cree | 0.0 /100 | #298 | Tragic 77.7% |
| Hispanics or Latinos | 0.0 /100 | #299 | Tragic 77.6% |
| Spanish American Indians | 0.0 /100 | #300 | Tragic 77.6% |
| Nepalese | 0.0 /100 | #301 | Tragic 77.5% |
| Iroquois | 0.0 /100 | #302 | Tragic 77.5% |
| Chippewa | 0.0 /100 | #303 | Tragic 77.3% |
| Immigrants | Mexico | 0.0 /100 | #304 | Tragic 77.3% |
| Mexicans | 0.0 /100 | #305 | Tragic 77.2% |
| Potawatomi | 0.0 /100 | #306 | Tragic 77.2% |
| Central American Indians | 0.0 /100 | #307 | Tragic 77.1% |
| Alaska Natives | 0.0 /100 | #308 | Tragic 77.0% |
| Americans | 0.0 /100 | #309 | Tragic 77.0% |