Aleut vs Immigrants from Saudi Arabia Family Poverty
COMPARE
Aleut
Immigrants from Saudi Arabia
Family Poverty
Family Poverty Comparison
Aleuts
Immigrants from Saudi Arabia
9.5%
FAMILY POVERTY
18.0/ 100
METRIC RATING
205th/ 347
METRIC RANK
9.1%
FAMILY POVERTY
38.6/ 100
METRIC RATING
185th/ 347
METRIC RANK
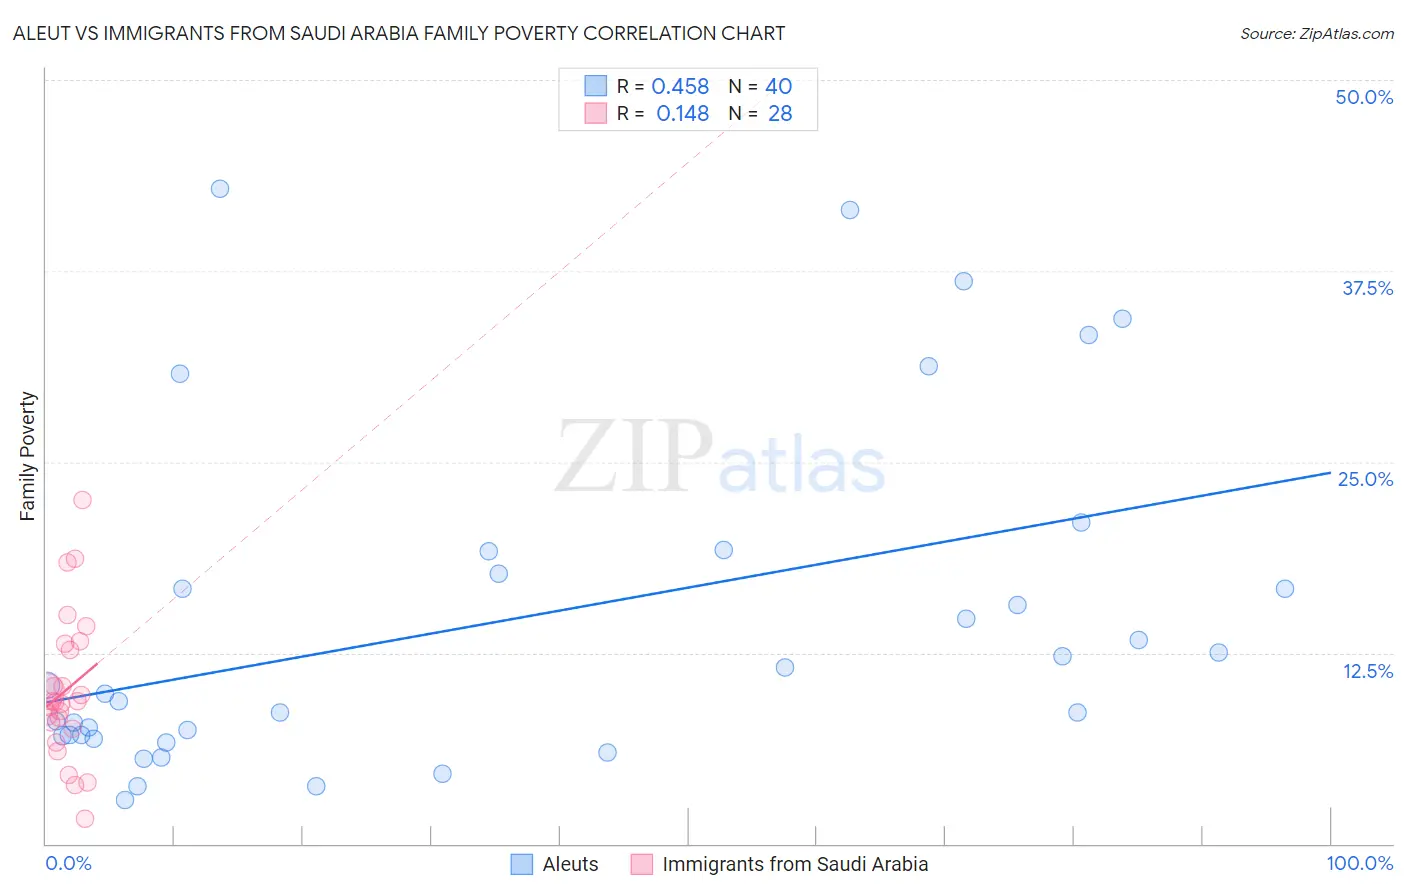
Aleut vs Immigrants from Saudi Arabia Family Poverty Correlation Chart
The statistical analysis conducted on geographies consisting of 61,739,595 people shows a moderate positive correlation between the proportion of Aleuts and poverty level among families in the United States with a correlation coefficient (R) of 0.458 and weighted average of 9.5%. Similarly, the statistical analysis conducted on geographies consisting of 164,117,419 people shows a poor positive correlation between the proportion of Immigrants from Saudi Arabia and poverty level among families in the United States with a correlation coefficient (R) of 0.148 and weighted average of 9.1%, a difference of 3.4%.
Family Poverty Correlation Summary
| Measurement | Aleut | Immigrants from Saudi Arabia |
| Minimum | 2.9% | 1.7% |
| Maximum | 42.9% | 22.5% |
| Range | 40.0% | 20.8% |
| Mean | 14.6% | 10.1% |
| Median | 10.1% | 9.3% |
| Interquartile 25% (IQ1) | 7.1% | 7.7% |
| Interquartile 75% (IQ3) | 18.4% | 12.9% |
| Interquartile Range (IQR) | 11.3% | 5.2% |
| Standard Deviation (Sample) | 11.0% | 4.7% |
| Standard Deviation (Population) | 10.9% | 4.6% |
Demographics Similar to Aleuts and Immigrants from Saudi Arabia by Family Poverty
In terms of family poverty, the demographic groups most similar to Aleuts are Immigrants from Lebanon (9.4%, a difference of 0.19%), German Russian (9.4%, a difference of 0.29%), Immigrants from Sierra Leone (9.4%, a difference of 0.33%), Immigrants from Portugal (9.4%, a difference of 0.51%), and Immigrants from Costa Rica (9.4%, a difference of 0.74%). Similarly, the demographic groups most similar to Immigrants from Saudi Arabia are Colombian (9.2%, a difference of 0.35%), Delaware (9.2%, a difference of 0.44%), Immigrants from Kenya (9.2%, a difference of 0.63%), Immigrants from Afghanistan (9.2%, a difference of 0.92%), and Arab (9.2%, a difference of 1.0%).
| Demographics | Rating | Rank | Family Poverty |
| Immigrants | Saudi Arabia | 38.6 /100 | #185 | Fair 9.1% |
| Colombians | 36.1 /100 | #186 | Fair 9.2% |
| Delaware | 35.4 /100 | #187 | Fair 9.2% |
| Immigrants | Kenya | 34.0 /100 | #188 | Fair 9.2% |
| Immigrants | Afghanistan | 32.1 /100 | #189 | Fair 9.2% |
| Arabs | 31.5 /100 | #190 | Fair 9.2% |
| Ugandans | 28.7 /100 | #191 | Fair 9.3% |
| Spanish | 28.7 /100 | #192 | Fair 9.3% |
| Immigrants | Western Asia | 28.2 /100 | #193 | Fair 9.3% |
| South Americans | 28.1 /100 | #194 | Fair 9.3% |
| Venezuelans | 27.4 /100 | #195 | Fair 9.3% |
| Immigrants | Venezuela | 26.1 /100 | #196 | Fair 9.3% |
| Immigrants | Colombia | 24.4 /100 | #197 | Fair 9.3% |
| Iraqis | 24.2 /100 | #198 | Fair 9.3% |
| Spaniards | 22.8 /100 | #199 | Fair 9.4% |
| Immigrants | Costa Rica | 21.7 /100 | #200 | Fair 9.4% |
| Immigrants | Portugal | 20.5 /100 | #201 | Fair 9.4% |
| Immigrants | Sierra Leone | 19.6 /100 | #202 | Poor 9.4% |
| German Russians | 19.4 /100 | #203 | Poor 9.4% |
| Immigrants | Lebanon | 18.9 /100 | #204 | Poor 9.4% |
| Aleuts | 18.0 /100 | #205 | Poor 9.5% |