Albanian vs Swedish 4 or more Vehicles in Household
COMPARE
Albanian
Swedish
4 or more Vehicles in Household
4 or more Vehicles in Household Comparison
Albanians
Swedes
4.8%
4 OR MORE VEHICLES IN HOUSEHOLD
0.0/ 100
METRIC RATING
312th/ 347
METRIC RANK
7.6%
4 OR MORE VEHICLES IN HOUSEHOLD
100.0/ 100
METRIC RATING
58th/ 347
METRIC RANK
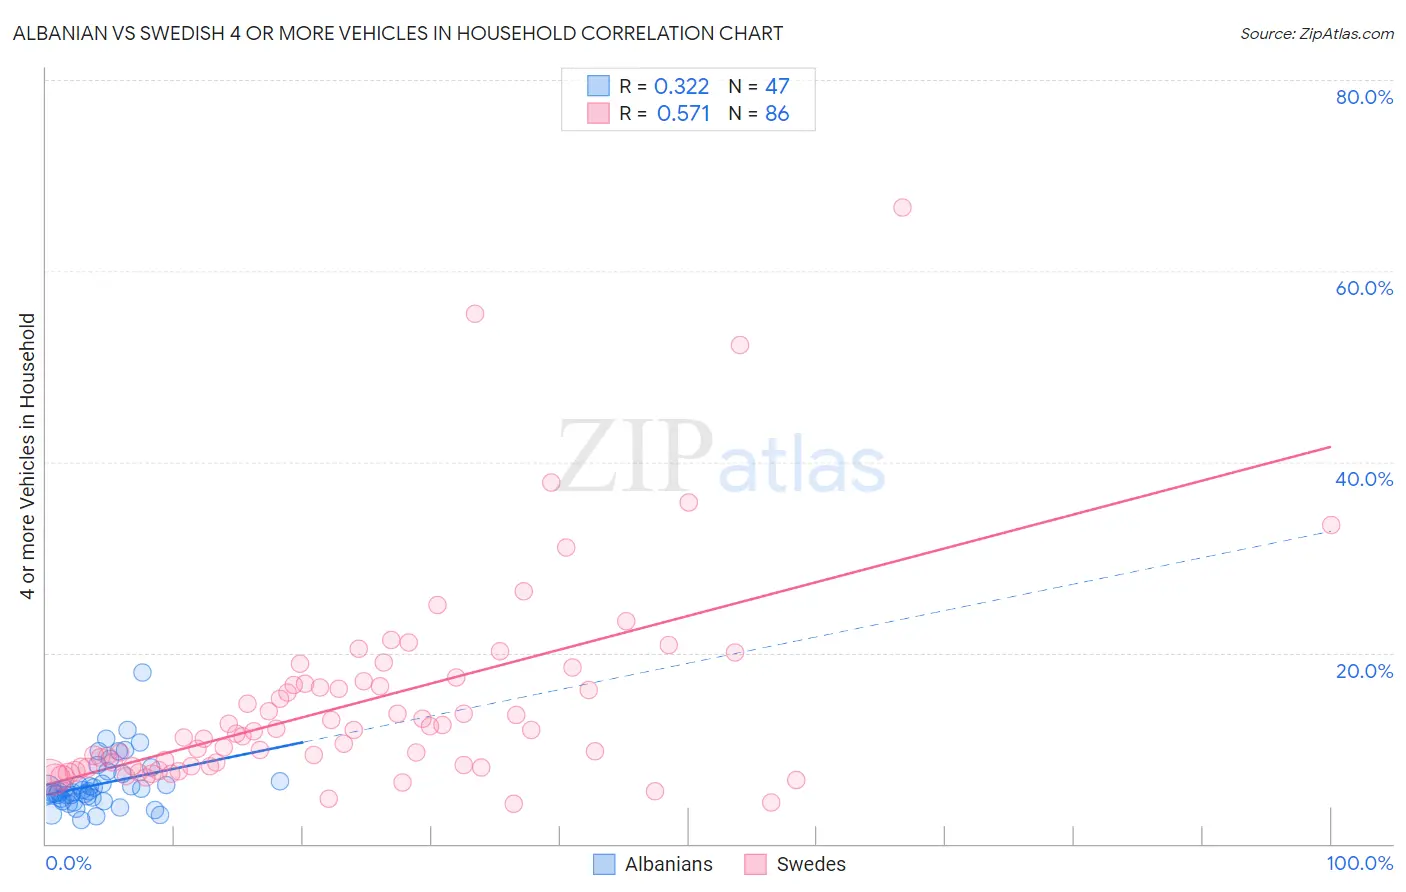
Albanian vs Swedish 4 or more Vehicles in Household Correlation Chart
The statistical analysis conducted on geographies consisting of 192,343,079 people shows a mild positive correlation between the proportion of Albanians and percentage of households with 4 or more vehicles available in the United States with a correlation coefficient (R) of 0.322 and weighted average of 4.8%. Similarly, the statistical analysis conducted on geographies consisting of 536,277,844 people shows a substantial positive correlation between the proportion of Swedes and percentage of households with 4 or more vehicles available in the United States with a correlation coefficient (R) of 0.571 and weighted average of 7.6%, a difference of 59.2%.
4 or more Vehicles in Household Correlation Summary
| Measurement | Albanian | Swedish |
| Minimum | 2.5% | 4.2% |
| Maximum | 18.0% | 66.7% |
| Range | 15.5% | 62.5% |
| Mean | 6.3% | 14.7% |
| Median | 5.5% | 11.6% |
| Interquartile 25% (IQ1) | 4.7% | 8.1% |
| Interquartile 75% (IQ3) | 7.3% | 16.7% |
| Interquartile Range (IQR) | 2.5% | 8.6% |
| Standard Deviation (Sample) | 2.8% | 10.8% |
| Standard Deviation (Population) | 2.8% | 10.8% |
Similar Demographics by 4 or more Vehicles in Household
Demographics Similar to Albanians by 4 or more Vehicles in Household
In terms of 4 or more vehicles in household, the demographic groups most similar to Albanians are Immigrants from Israel (4.8%, a difference of 0.010%), Immigrants from West Indies (4.7%, a difference of 0.81%), Immigrants from Belarus (4.7%, a difference of 0.90%), Puerto Rican (4.7%, a difference of 1.3%), and Houma (4.9%, a difference of 2.7%).
| Demographics | Rating | Rank | 4 or more Vehicles in Household |
| Somalis | 0.0 /100 | #305 | Tragic 5.0% |
| Immigrants | Serbia | 0.0 /100 | #306 | Tragic 5.0% |
| Menominee | 0.0 /100 | #307 | Tragic 5.0% |
| Paraguayans | 0.0 /100 | #308 | Tragic 4.9% |
| Immigrants | Somalia | 0.0 /100 | #309 | Tragic 4.9% |
| Moroccans | 0.0 /100 | #310 | Tragic 4.9% |
| Houma | 0.0 /100 | #311 | Tragic 4.9% |
| Albanians | 0.0 /100 | #312 | Tragic 4.8% |
| Immigrants | Israel | 0.0 /100 | #313 | Tragic 4.8% |
| Immigrants | West Indies | 0.0 /100 | #314 | Tragic 4.7% |
| Immigrants | Belarus | 0.0 /100 | #315 | Tragic 4.7% |
| Puerto Ricans | 0.0 /100 | #316 | Tragic 4.7% |
| U.S. Virgin Islanders | 0.0 /100 | #317 | Tragic 4.6% |
| Jamaicans | 0.0 /100 | #318 | Tragic 4.6% |
| Haitians | 0.0 /100 | #319 | Tragic 4.6% |
Demographics Similar to Swedes by 4 or more Vehicles in Household
In terms of 4 or more vehicles in household, the demographic groups most similar to Swedes are Pennsylvania German (7.6%, a difference of 0.0%), Hispanic or Latino (7.6%, a difference of 0.040%), Spaniard (7.6%, a difference of 0.10%), English (7.6%, a difference of 0.12%), and Immigrants from Oceania (7.6%, a difference of 0.14%).
| Demographics | Rating | Rank | 4 or more Vehicles in Household |
| Immigrants | Laos | 100.0 /100 | #51 | Exceptional 7.7% |
| Japanese | 100.0 /100 | #52 | Exceptional 7.7% |
| Malaysians | 100.0 /100 | #53 | Exceptional 7.7% |
| Dutch | 100.0 /100 | #54 | Exceptional 7.7% |
| Immigrants | Oceania | 100.0 /100 | #55 | Exceptional 7.6% |
| English | 100.0 /100 | #56 | Exceptional 7.6% |
| Pennsylvania Germans | 100.0 /100 | #57 | Exceptional 7.6% |
| Swedes | 100.0 /100 | #58 | Exceptional 7.6% |
| Hispanics or Latinos | 100.0 /100 | #59 | Exceptional 7.6% |
| Spaniards | 100.0 /100 | #60 | Exceptional 7.6% |
| Europeans | 100.0 /100 | #61 | Exceptional 7.6% |
| Chippewa | 100.0 /100 | #62 | Exceptional 7.6% |
| Immigrants | Micronesia | 100.0 /100 | #63 | Exceptional 7.6% |
| Bangladeshis | 100.0 /100 | #64 | Exceptional 7.6% |
| Immigrants | Azores | 100.0 /100 | #65 | Exceptional 7.5% |