Uruguayan vs Swedish 4 or more Vehicles in Household
COMPARE
Uruguayan
Swedish
4 or more Vehicles in Household
4 or more Vehicles in Household Comparison
Uruguayans
Swedes
5.6%
4 OR MORE VEHICLES IN HOUSEHOLD
1.3/ 100
METRIC RATING
260th/ 347
METRIC RANK
7.6%
4 OR MORE VEHICLES IN HOUSEHOLD
100.0/ 100
METRIC RATING
58th/ 347
METRIC RANK
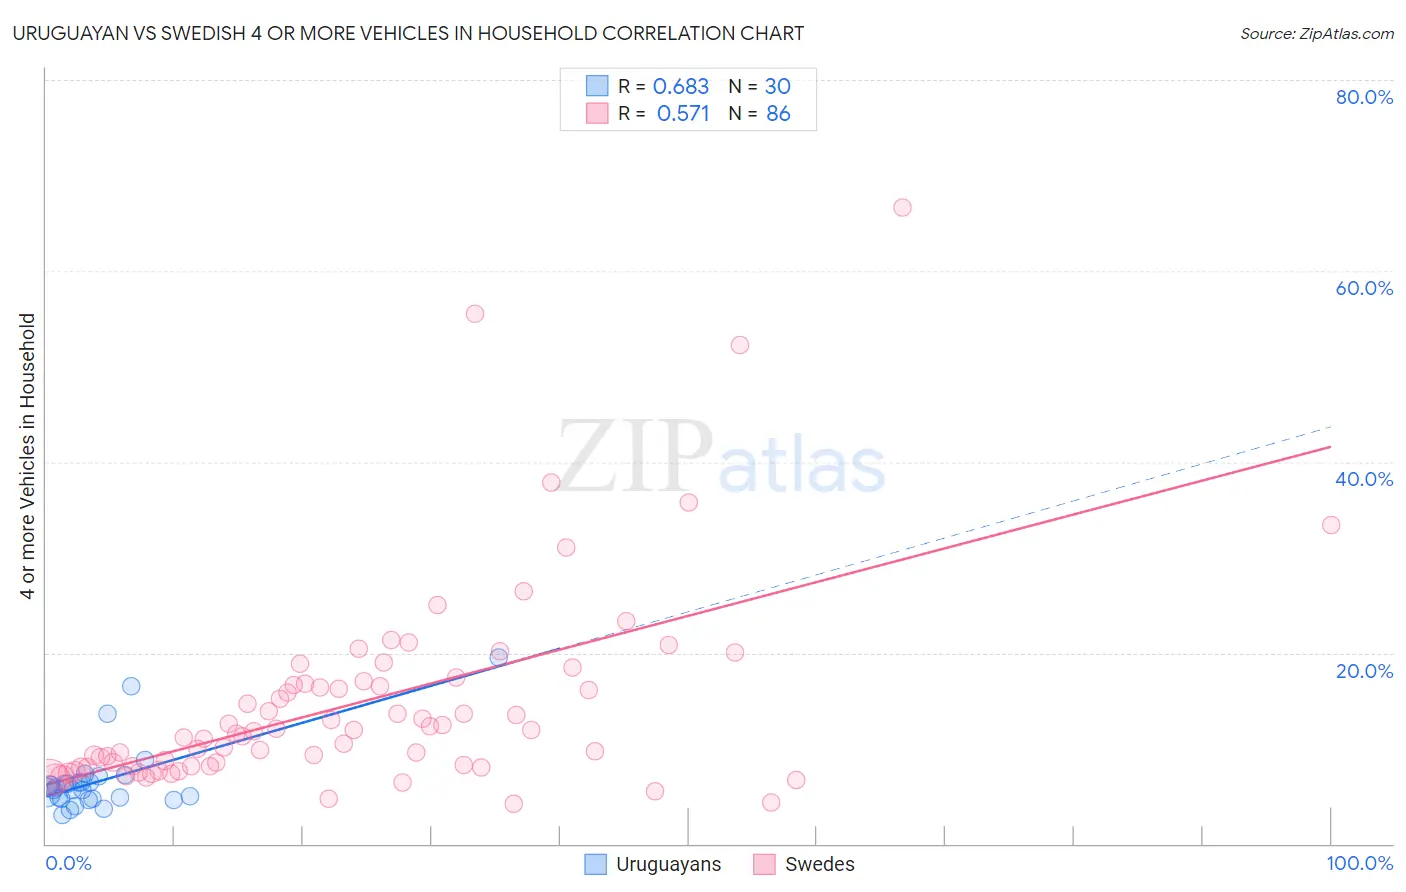
Uruguayan vs Swedish 4 or more Vehicles in Household Correlation Chart
The statistical analysis conducted on geographies consisting of 144,399,753 people shows a significant positive correlation between the proportion of Uruguayans and percentage of households with 4 or more vehicles available in the United States with a correlation coefficient (R) of 0.683 and weighted average of 5.6%. Similarly, the statistical analysis conducted on geographies consisting of 536,277,844 people shows a substantial positive correlation between the proportion of Swedes and percentage of households with 4 or more vehicles available in the United States with a correlation coefficient (R) of 0.571 and weighted average of 7.6%, a difference of 35.3%.
4 or more Vehicles in Household Correlation Summary
| Measurement | Uruguayan | Swedish |
| Minimum | 3.1% | 4.2% |
| Maximum | 19.5% | 66.7% |
| Range | 16.5% | 62.5% |
| Mean | 6.7% | 14.7% |
| Median | 5.8% | 11.6% |
| Interquartile 25% (IQ1) | 4.7% | 8.1% |
| Interquartile 75% (IQ3) | 6.5% | 16.7% |
| Interquartile Range (IQR) | 1.7% | 8.6% |
| Standard Deviation (Sample) | 3.7% | 10.8% |
| Standard Deviation (Population) | 3.6% | 10.8% |
Similar Demographics by 4 or more Vehicles in Household
Demographics Similar to Uruguayans by 4 or more Vehicles in Household
In terms of 4 or more vehicles in household, the demographic groups most similar to Uruguayans are Sudanese (5.6%, a difference of 0.090%), Immigrants from France (5.6%, a difference of 0.18%), Bermudan (5.6%, a difference of 0.20%), Immigrants from Lithuania (5.6%, a difference of 0.22%), and Immigrants from Saudi Arabia (5.6%, a difference of 0.29%).
| Demographics | Rating | Rank | 4 or more Vehicles in Household |
| Immigrants | Cuba | 1.6 /100 | #253 | Tragic 5.7% |
| Immigrants | Panama | 1.5 /100 | #254 | Tragic 5.7% |
| Yup'ik | 1.5 /100 | #255 | Tragic 5.7% |
| Immigrants | Turkey | 1.5 /100 | #256 | Tragic 5.7% |
| Immigrants | Northern Africa | 1.4 /100 | #257 | Tragic 5.6% |
| Immigrants | Lithuania | 1.4 /100 | #258 | Tragic 5.6% |
| Immigrants | France | 1.3 /100 | #259 | Tragic 5.6% |
| Uruguayans | 1.3 /100 | #260 | Tragic 5.6% |
| Sudanese | 1.2 /100 | #261 | Tragic 5.6% |
| Bermudans | 1.2 /100 | #262 | Tragic 5.6% |
| Immigrants | Saudi Arabia | 1.1 /100 | #263 | Tragic 5.6% |
| Immigrants | Africa | 1.0 /100 | #264 | Tragic 5.6% |
| South Americans | 0.9 /100 | #265 | Tragic 5.6% |
| Immigrants | Nepal | 0.9 /100 | #266 | Tragic 5.6% |
| Immigrants | Ukraine | 0.9 /100 | #267 | Tragic 5.6% |
Demographics Similar to Swedes by 4 or more Vehicles in Household
In terms of 4 or more vehicles in household, the demographic groups most similar to Swedes are Pennsylvania German (7.6%, a difference of 0.0%), Hispanic or Latino (7.6%, a difference of 0.040%), Spaniard (7.6%, a difference of 0.10%), English (7.6%, a difference of 0.12%), and Immigrants from Oceania (7.6%, a difference of 0.14%).
| Demographics | Rating | Rank | 4 or more Vehicles in Household |
| Immigrants | Laos | 100.0 /100 | #51 | Exceptional 7.7% |
| Japanese | 100.0 /100 | #52 | Exceptional 7.7% |
| Malaysians | 100.0 /100 | #53 | Exceptional 7.7% |
| Dutch | 100.0 /100 | #54 | Exceptional 7.7% |
| Immigrants | Oceania | 100.0 /100 | #55 | Exceptional 7.6% |
| English | 100.0 /100 | #56 | Exceptional 7.6% |
| Pennsylvania Germans | 100.0 /100 | #57 | Exceptional 7.6% |
| Swedes | 100.0 /100 | #58 | Exceptional 7.6% |
| Hispanics or Latinos | 100.0 /100 | #59 | Exceptional 7.6% |
| Spaniards | 100.0 /100 | #60 | Exceptional 7.6% |
| Europeans | 100.0 /100 | #61 | Exceptional 7.6% |
| Chippewa | 100.0 /100 | #62 | Exceptional 7.6% |
| Immigrants | Micronesia | 100.0 /100 | #63 | Exceptional 7.6% |
| Bangladeshis | 100.0 /100 | #64 | Exceptional 7.6% |
| Immigrants | Azores | 100.0 /100 | #65 | Exceptional 7.5% |