Albanian vs Swedish 6th Grade
COMPARE
Albanian
Swedish
6th Grade
6th Grade Comparison
Albanians
Swedes
97.1%
6TH GRADE
57.8/ 100
METRIC RATING
163rd/ 347
METRIC RANK
98.2%
6TH GRADE
100.0/ 100
METRIC RATING
10th/ 347
METRIC RANK
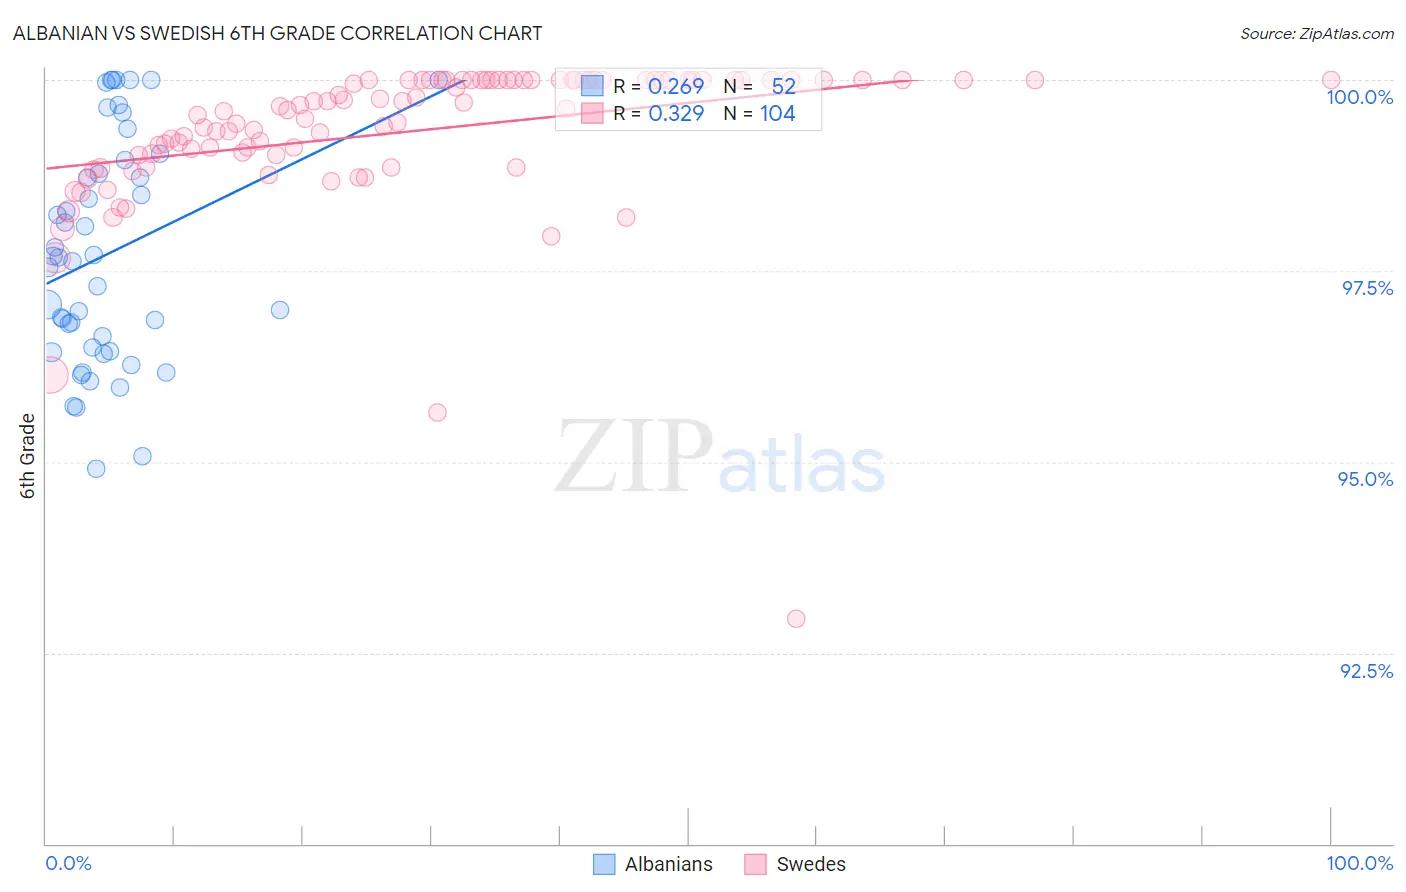
Albanian vs Swedish 6th Grade Correlation Chart
The statistical analysis conducted on geographies consisting of 193,265,850 people shows a weak positive correlation between the proportion of Albanians and percentage of population with at least 6th grade education in the United States with a correlation coefficient (R) of 0.269 and weighted average of 97.1%. Similarly, the statistical analysis conducted on geographies consisting of 539,231,492 people shows a mild positive correlation between the proportion of Swedes and percentage of population with at least 6th grade education in the United States with a correlation coefficient (R) of 0.329 and weighted average of 98.2%, a difference of 1.1%.
6th Grade Correlation Summary
| Measurement | Albanian | Swedish |
| Minimum | 94.9% | 92.9% |
| Maximum | 100.0% | 100.0% |
| Range | 5.1% | 7.1% |
| Mean | 97.7% | 99.3% |
| Median | 97.7% | 99.6% |
| Interquartile 25% (IQ1) | 96.5% | 99.0% |
| Interquartile 75% (IQ3) | 98.9% | 100.0% |
| Interquartile Range (IQR) | 2.4% | 0.98% |
| Standard Deviation (Sample) | 1.5% | 1.00% |
| Standard Deviation (Population) | 1.5% | 0.99% |
Similar Demographics by 6th Grade
Demographics Similar to Albanians by 6th Grade
In terms of 6th grade, the demographic groups most similar to Albanians are Immigrants from Korea (97.1%, a difference of 0.0%), Immigrants from Belarus (97.1%, a difference of 0.010%), Marshallese (97.1%, a difference of 0.010%), Immigrants from Poland (97.1%, a difference of 0.010%), and Kenyan (97.1%, a difference of 0.020%).
| Demographics | Rating | Rank | 6th Grade |
| Alsatians | 69.8 /100 | #156 | Good 97.1% |
| Immigrants | Russia | 67.6 /100 | #157 | Good 97.1% |
| Immigrants | Iran | 63.3 /100 | #158 | Good 97.1% |
| Kenyans | 62.9 /100 | #159 | Good 97.1% |
| Ugandans | 62.2 /100 | #160 | Good 97.1% |
| Immigrants | Belarus | 60.4 /100 | #161 | Good 97.1% |
| Marshallese | 60.2 /100 | #162 | Good 97.1% |
| Albanians | 57.8 /100 | #163 | Average 97.1% |
| Immigrants | Korea | 57.7 /100 | #164 | Average 97.1% |
| Immigrants | Poland | 56.2 /100 | #165 | Average 97.1% |
| Immigrants | Italy | 53.8 /100 | #166 | Average 97.1% |
| Apache | 53.6 /100 | #167 | Average 97.1% |
| Immigrants | Taiwan | 53.5 /100 | #168 | Average 97.1% |
| Bermudans | 52.6 /100 | #169 | Average 97.1% |
| Chileans | 52.1 /100 | #170 | Average 97.1% |
Demographics Similar to Swedes by 6th Grade
In terms of 6th grade, the demographic groups most similar to Swedes are English (98.1%, a difference of 0.010%), Alaskan Athabascan (98.1%, a difference of 0.020%), Slovene (98.2%, a difference of 0.030%), Tlingit-Haida (98.1%, a difference of 0.040%), and Carpatho Rusyn (98.1%, a difference of 0.050%).
| Demographics | Rating | Rank | 6th Grade |
| Welsh | 100.0 /100 | #3 | Exceptional 98.5% |
| Dutch | 100.0 /100 | #4 | Exceptional 98.4% |
| Tsimshian | 100.0 /100 | #5 | Exceptional 98.3% |
| Norwegians | 100.0 /100 | #6 | Exceptional 98.3% |
| Germans | 100.0 /100 | #7 | Exceptional 98.2% |
| Slovaks | 100.0 /100 | #8 | Exceptional 98.2% |
| Slovenes | 100.0 /100 | #9 | Exceptional 98.2% |
| Swedes | 100.0 /100 | #10 | Exceptional 98.2% |
| English | 100.0 /100 | #11 | Exceptional 98.1% |
| Alaskan Athabascans | 100.0 /100 | #12 | Exceptional 98.1% |
| Tlingit-Haida | 100.0 /100 | #13 | Exceptional 98.1% |
| Carpatho Rusyns | 100.0 /100 | #14 | Exceptional 98.1% |
| Inupiat | 100.0 /100 | #15 | Exceptional 98.1% |
| Scottish | 100.0 /100 | #16 | Exceptional 98.1% |
| Poles | 100.0 /100 | #17 | Exceptional 98.1% |