Albanian vs Nigerian 4 or more Vehicles in Household
COMPARE
Albanian
Nigerian
4 or more Vehicles in Household
4 or more Vehicles in Household Comparison
Albanians
Nigerians
4.8%
4 OR MORE VEHICLES IN HOUSEHOLD
0.0/ 100
METRIC RATING
312th/ 347
METRIC RANK
6.0%
4 OR MORE VEHICLES IN HOUSEHOLD
12.2/ 100
METRIC RATING
217th/ 347
METRIC RANK
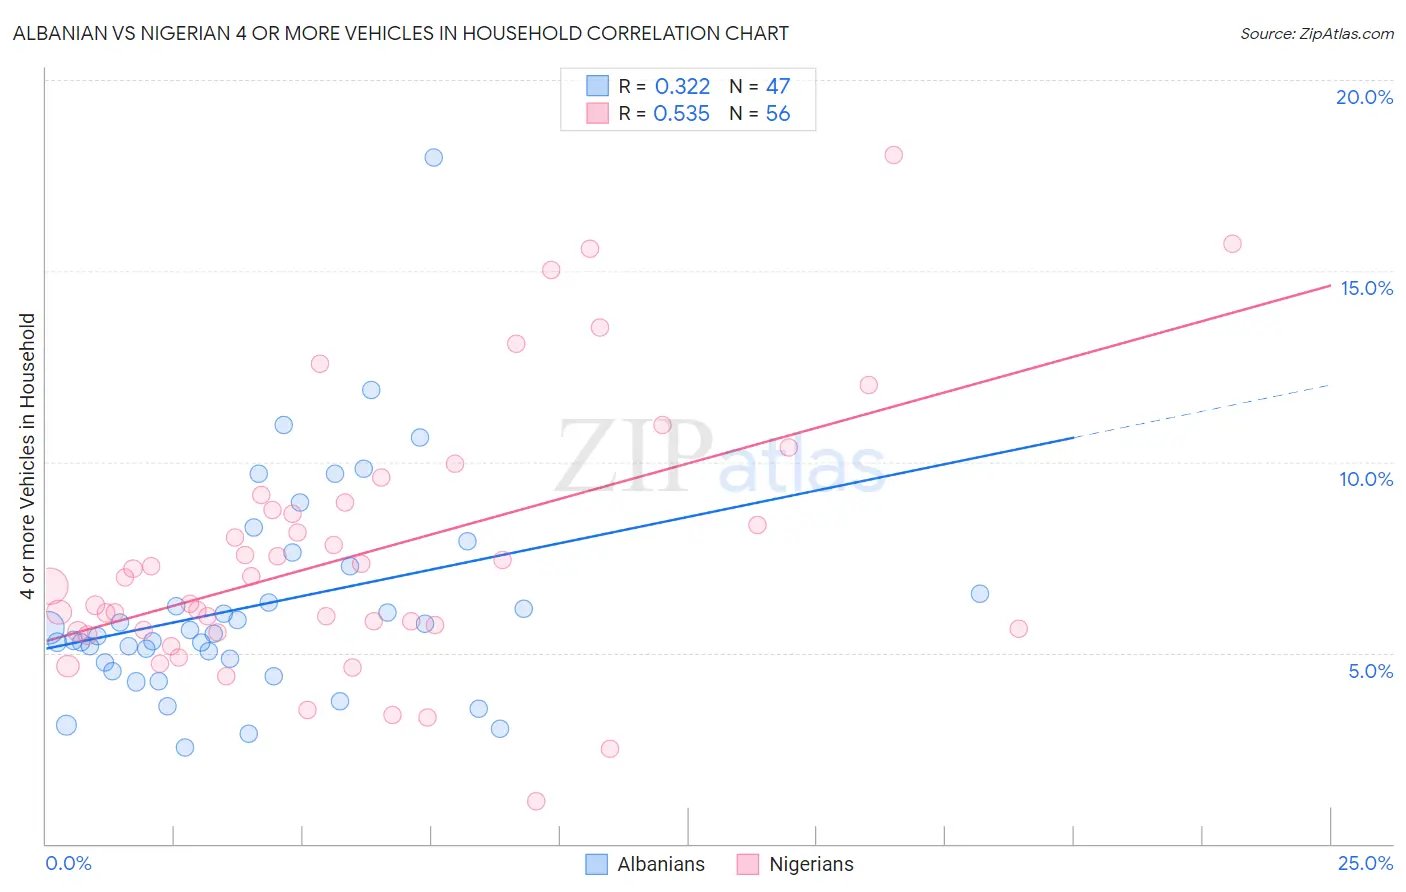
Albanian vs Nigerian 4 or more Vehicles in Household Correlation Chart
The statistical analysis conducted on geographies consisting of 192,343,079 people shows a mild positive correlation between the proportion of Albanians and percentage of households with 4 or more vehicles available in the United States with a correlation coefficient (R) of 0.322 and weighted average of 4.8%. Similarly, the statistical analysis conducted on geographies consisting of 331,155,692 people shows a substantial positive correlation between the proportion of Nigerians and percentage of households with 4 or more vehicles available in the United States with a correlation coefficient (R) of 0.535 and weighted average of 6.0%, a difference of 25.6%.
4 or more Vehicles in Household Correlation Summary
| Measurement | Albanian | Nigerian |
| Minimum | 2.5% | 1.1% |
| Maximum | 18.0% | 18.0% |
| Range | 15.5% | 16.9% |
| Mean | 6.3% | 7.6% |
| Median | 5.5% | 6.9% |
| Interquartile 25% (IQ1) | 4.7% | 5.6% |
| Interquartile 75% (IQ3) | 7.3% | 8.8% |
| Interquartile Range (IQR) | 2.5% | 3.3% |
| Standard Deviation (Sample) | 2.8% | 3.5% |
| Standard Deviation (Population) | 2.8% | 3.4% |
Similar Demographics by 4 or more Vehicles in Household
Demographics Similar to Albanians by 4 or more Vehicles in Household
In terms of 4 or more vehicles in household, the demographic groups most similar to Albanians are Immigrants from Israel (4.8%, a difference of 0.010%), Immigrants from West Indies (4.7%, a difference of 0.81%), Immigrants from Belarus (4.7%, a difference of 0.90%), Puerto Rican (4.7%, a difference of 1.3%), and Houma (4.9%, a difference of 2.7%).
| Demographics | Rating | Rank | 4 or more Vehicles in Household |
| Somalis | 0.0 /100 | #305 | Tragic 5.0% |
| Immigrants | Serbia | 0.0 /100 | #306 | Tragic 5.0% |
| Menominee | 0.0 /100 | #307 | Tragic 5.0% |
| Paraguayans | 0.0 /100 | #308 | Tragic 4.9% |
| Immigrants | Somalia | 0.0 /100 | #309 | Tragic 4.9% |
| Moroccans | 0.0 /100 | #310 | Tragic 4.9% |
| Houma | 0.0 /100 | #311 | Tragic 4.9% |
| Albanians | 0.0 /100 | #312 | Tragic 4.8% |
| Immigrants | Israel | 0.0 /100 | #313 | Tragic 4.8% |
| Immigrants | West Indies | 0.0 /100 | #314 | Tragic 4.7% |
| Immigrants | Belarus | 0.0 /100 | #315 | Tragic 4.7% |
| Puerto Ricans | 0.0 /100 | #316 | Tragic 4.7% |
| U.S. Virgin Islanders | 0.0 /100 | #317 | Tragic 4.6% |
| Jamaicans | 0.0 /100 | #318 | Tragic 4.6% |
| Haitians | 0.0 /100 | #319 | Tragic 4.6% |
Demographics Similar to Nigerians by 4 or more Vehicles in Household
In terms of 4 or more vehicles in household, the demographic groups most similar to Nigerians are Immigrants from Italy (6.0%, a difference of 0.31%), Serbian (6.0%, a difference of 0.31%), Immigrants from China (6.0%, a difference of 0.39%), Immigrants from Romania (6.0%, a difference of 0.39%), and Immigrants from Austria (6.0%, a difference of 0.50%).
| Demographics | Rating | Rank | 4 or more Vehicles in Household |
| Immigrants | Zimbabwe | 15.1 /100 | #210 | Poor 6.0% |
| Panamanians | 14.8 /100 | #211 | Poor 6.0% |
| Immigrants | Egypt | 14.7 /100 | #212 | Poor 6.0% |
| Arabs | 14.4 /100 | #213 | Poor 6.0% |
| Immigrants | Austria | 14.3 /100 | #214 | Poor 6.0% |
| Immigrants | China | 13.8 /100 | #215 | Poor 6.0% |
| Immigrants | Romania | 13.8 /100 | #216 | Poor 6.0% |
| Nigerians | 12.2 /100 | #217 | Poor 6.0% |
| Immigrants | Italy | 11.0 /100 | #218 | Poor 6.0% |
| Serbians | 11.0 /100 | #219 | Poor 6.0% |
| Russians | 10.3 /100 | #220 | Poor 6.0% |
| Immigrants | Moldova | 9.3 /100 | #221 | Tragic 6.0% |
| Cajuns | 9.2 /100 | #222 | Tragic 6.0% |
| Immigrants | Kenya | 9.2 /100 | #223 | Tragic 6.0% |
| Cubans | 9.2 /100 | #224 | Tragic 6.0% |