Choctaw vs Swedish 4 or more Vehicles in Household
COMPARE
Choctaw
Swedish
4 or more Vehicles in Household
4 or more Vehicles in Household Comparison
Choctaw
Swedes
7.8%
4 OR MORE VEHICLES IN HOUSEHOLD
100.0/ 100
METRIC RATING
45th/ 347
METRIC RANK
7.6%
4 OR MORE VEHICLES IN HOUSEHOLD
100.0/ 100
METRIC RATING
58th/ 347
METRIC RANK
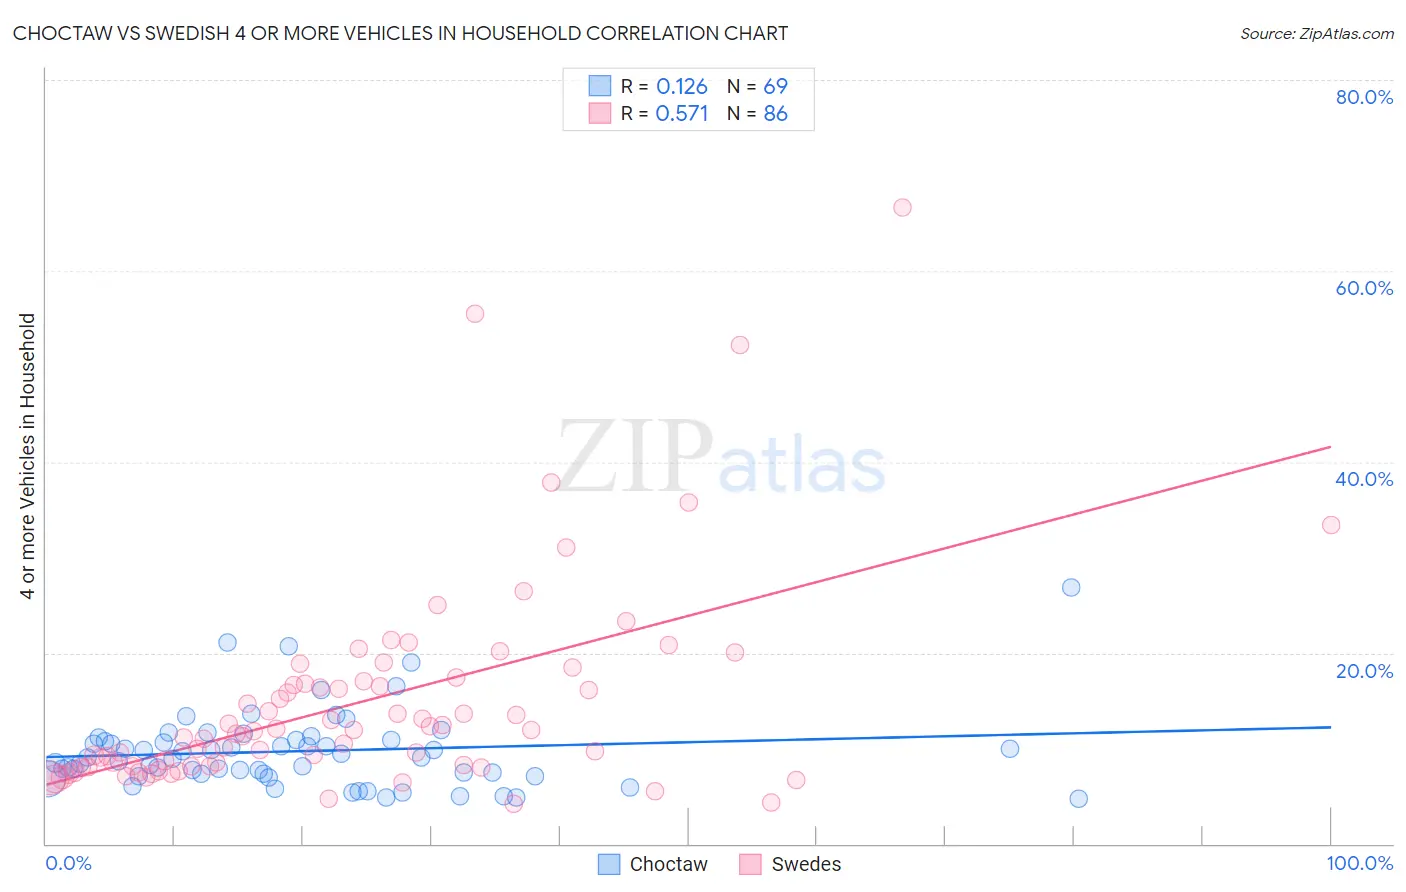
Choctaw vs Swedish 4 or more Vehicles in Household Correlation Chart
The statistical analysis conducted on geographies consisting of 269,154,664 people shows a poor positive correlation between the proportion of Choctaw and percentage of households with 4 or more vehicles available in the United States with a correlation coefficient (R) of 0.126 and weighted average of 7.8%. Similarly, the statistical analysis conducted on geographies consisting of 536,277,844 people shows a substantial positive correlation between the proportion of Swedes and percentage of households with 4 or more vehicles available in the United States with a correlation coefficient (R) of 0.571 and weighted average of 7.6%, a difference of 2.3%.
4 or more Vehicles in Household Correlation Summary
| Measurement | Choctaw | Swedish |
| Minimum | 4.7% | 4.2% |
| Maximum | 26.9% | 66.7% |
| Range | 22.2% | 62.5% |
| Mean | 9.7% | 14.7% |
| Median | 9.0% | 11.6% |
| Interquartile 25% (IQ1) | 7.3% | 8.1% |
| Interquartile 75% (IQ3) | 10.8% | 16.7% |
| Interquartile Range (IQR) | 3.5% | 8.6% |
| Standard Deviation (Sample) | 4.1% | 10.8% |
| Standard Deviation (Population) | 4.0% | 10.8% |
Demographics Similar to Choctaw and Swedes by 4 or more Vehicles in Household
In terms of 4 or more vehicles in household, the demographic groups most similar to Choctaw are Bhutanese (7.8%, a difference of 0.050%), Crow (7.8%, a difference of 0.17%), Fijian (7.8%, a difference of 0.31%), Osage (7.8%, a difference of 0.33%), and Salvadoran (7.8%, a difference of 0.43%). Similarly, the demographic groups most similar to Swedes are Pennsylvania German (7.6%, a difference of 0.0%), Hispanic or Latino (7.6%, a difference of 0.040%), Spaniard (7.6%, a difference of 0.10%), English (7.6%, a difference of 0.12%), and Immigrants from Oceania (7.6%, a difference of 0.14%).
| Demographics | Rating | Rank | 4 or more Vehicles in Household |
| Pima | 100.0 /100 | #41 | Exceptional 7.9% |
| Salvadorans | 100.0 /100 | #42 | Exceptional 7.8% |
| Fijians | 100.0 /100 | #43 | Exceptional 7.8% |
| Bhutanese | 100.0 /100 | #44 | Exceptional 7.8% |
| Choctaw | 100.0 /100 | #45 | Exceptional 7.8% |
| Crow | 100.0 /100 | #46 | Exceptional 7.8% |
| Osage | 100.0 /100 | #47 | Exceptional 7.8% |
| Swiss | 100.0 /100 | #48 | Exceptional 7.8% |
| Cherokee | 100.0 /100 | #49 | Exceptional 7.7% |
| Immigrants | El Salvador | 100.0 /100 | #50 | Exceptional 7.7% |
| Immigrants | Laos | 100.0 /100 | #51 | Exceptional 7.7% |
| Japanese | 100.0 /100 | #52 | Exceptional 7.7% |
| Malaysians | 100.0 /100 | #53 | Exceptional 7.7% |
| Dutch | 100.0 /100 | #54 | Exceptional 7.7% |
| Immigrants | Oceania | 100.0 /100 | #55 | Exceptional 7.6% |
| English | 100.0 /100 | #56 | Exceptional 7.6% |
| Pennsylvania Germans | 100.0 /100 | #57 | Exceptional 7.6% |
| Swedes | 100.0 /100 | #58 | Exceptional 7.6% |
| Hispanics or Latinos | 100.0 /100 | #59 | Exceptional 7.6% |
| Spaniards | 100.0 /100 | #60 | Exceptional 7.6% |
| Europeans | 100.0 /100 | #61 | Exceptional 7.6% |