Alaska Native vs Samoan 4 or more Vehicles in Household
COMPARE
Alaska Native
Samoan
4 or more Vehicles in Household
4 or more Vehicles in Household Comparison
Alaska Natives
Samoans
7.3%
4 OR MORE VEHICLES IN HOUSEHOLD
99.8/ 100
METRIC RATING
80th/ 347
METRIC RANK
9.2%
4 OR MORE VEHICLES IN HOUSEHOLD
100.0/ 100
METRIC RATING
9th/ 347
METRIC RANK
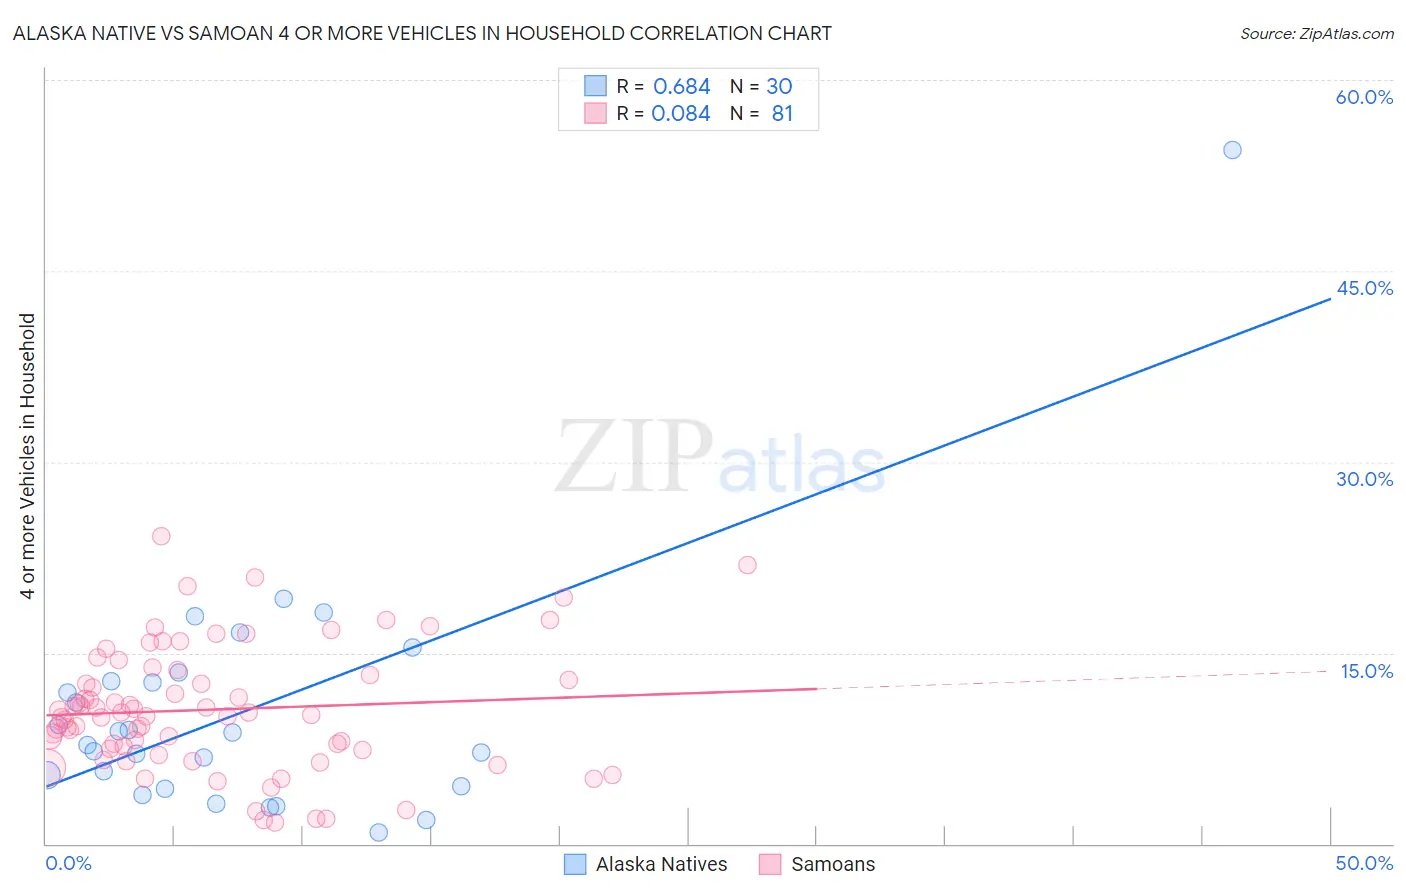
Alaska Native vs Samoan 4 or more Vehicles in Household Correlation Chart
The statistical analysis conducted on geographies consisting of 76,511,900 people shows a significant positive correlation between the proportion of Alaska Natives and percentage of households with 4 or more vehicles available in the United States with a correlation coefficient (R) of 0.684 and weighted average of 7.3%. Similarly, the statistical analysis conducted on geographies consisting of 224,510,493 people shows a slight positive correlation between the proportion of Samoans and percentage of households with 4 or more vehicles available in the United States with a correlation coefficient (R) of 0.084 and weighted average of 9.2%, a difference of 25.6%.
4 or more Vehicles in Household Correlation Summary
| Measurement | Alaska Native | Samoan |
| Minimum | 0.90% | 1.7% |
| Maximum | 54.5% | 24.2% |
| Range | 53.6% | 22.5% |
| Mean | 10.4% | 10.5% |
| Median | 8.3% | 10.1% |
| Interquartile 25% (IQ1) | 4.5% | 7.4% |
| Interquartile 75% (IQ3) | 12.7% | 13.5% |
| Interquartile Range (IQR) | 8.2% | 6.1% |
| Standard Deviation (Sample) | 9.8% | 4.9% |
| Standard Deviation (Population) | 9.6% | 4.8% |
Similar Demographics by 4 or more Vehicles in Household
Demographics Similar to Alaska Natives by 4 or more Vehicles in Household
In terms of 4 or more vehicles in household, the demographic groups most similar to Alaska Natives are Czech (7.4%, a difference of 0.14%), White/Caucasian (7.4%, a difference of 0.31%), Apache (7.4%, a difference of 0.38%), Laotian (7.4%, a difference of 0.54%), and Finnish (7.3%, a difference of 0.56%).
| Demographics | Rating | Rank | 4 or more Vehicles in Household |
| Portuguese | 99.9 /100 | #73 | Exceptional 7.4% |
| Icelanders | 99.9 /100 | #74 | Exceptional 7.4% |
| Immigrants | Cambodia | 99.9 /100 | #75 | Exceptional 7.4% |
| Laotians | 99.9 /100 | #76 | Exceptional 7.4% |
| Apache | 99.9 /100 | #77 | Exceptional 7.4% |
| Whites/Caucasians | 99.8 /100 | #78 | Exceptional 7.4% |
| Czechs | 99.8 /100 | #79 | Exceptional 7.4% |
| Alaska Natives | 99.8 /100 | #80 | Exceptional 7.3% |
| Finns | 99.8 /100 | #81 | Exceptional 7.3% |
| Northern Europeans | 99.8 /100 | #82 | Exceptional 7.3% |
| Potawatomi | 99.7 /100 | #83 | Exceptional 7.3% |
| Afghans | 99.7 /100 | #84 | Exceptional 7.3% |
| Cree | 99.7 /100 | #85 | Exceptional 7.2% |
| Immigrants | Indonesia | 99.6 /100 | #86 | Exceptional 7.2% |
| Delaware | 99.6 /100 | #87 | Exceptional 7.2% |
Demographics Similar to Samoans by 4 or more Vehicles in Household
In terms of 4 or more vehicles in household, the demographic groups most similar to Samoans are Arapaho (9.4%, a difference of 1.4%), Native Hawaiian (9.4%, a difference of 1.8%), Puget Sound Salish (9.4%, a difference of 1.8%), Paiute (9.0%, a difference of 2.4%), and Immigrants from Mexico (9.0%, a difference of 2.5%).
| Demographics | Rating | Rank | 4 or more Vehicles in Household |
| Colville | 100.0 /100 | #2 | Exceptional 11.1% |
| Spanish American Indians | 100.0 /100 | #3 | Exceptional 10.8% |
| Tongans | 100.0 /100 | #4 | Exceptional 10.0% |
| Immigrants | Fiji | 100.0 /100 | #5 | Exceptional 9.6% |
| Puget Sound Salish | 100.0 /100 | #6 | Exceptional 9.4% |
| Native Hawaiians | 100.0 /100 | #7 | Exceptional 9.4% |
| Arapaho | 100.0 /100 | #8 | Exceptional 9.4% |
| Samoans | 100.0 /100 | #9 | Exceptional 9.2% |
| Paiute | 100.0 /100 | #10 | Exceptional 9.0% |
| Immigrants | Mexico | 100.0 /100 | #11 | Exceptional 9.0% |
| Mexicans | 100.0 /100 | #12 | Exceptional 8.9% |
| Hawaiians | 100.0 /100 | #13 | Exceptional 8.9% |
| Chinese | 100.0 /100 | #14 | Exceptional 8.8% |
| Shoshone | 100.0 /100 | #15 | Exceptional 8.8% |
| Lumbee | 100.0 /100 | #16 | Exceptional 8.8% |