Alaska Native vs Immigrants from Cabo Verde Householder Income Over 65 years
COMPARE
Alaska Native
Immigrants from Cabo Verde
Householder Income Over 65 years
Householder Income Over 65 years Comparison
Alaska Natives
Immigrants from Cabo Verde
$60,748
HOUSEHOLDER INCOME OVER 65 YEARS
44.3/ 100
METRIC RATING
177th/ 347
METRIC RANK
$46,654
HOUSEHOLDER INCOME OVER 65 YEARS
0.0/ 100
METRIC RATING
342nd/ 347
METRIC RANK
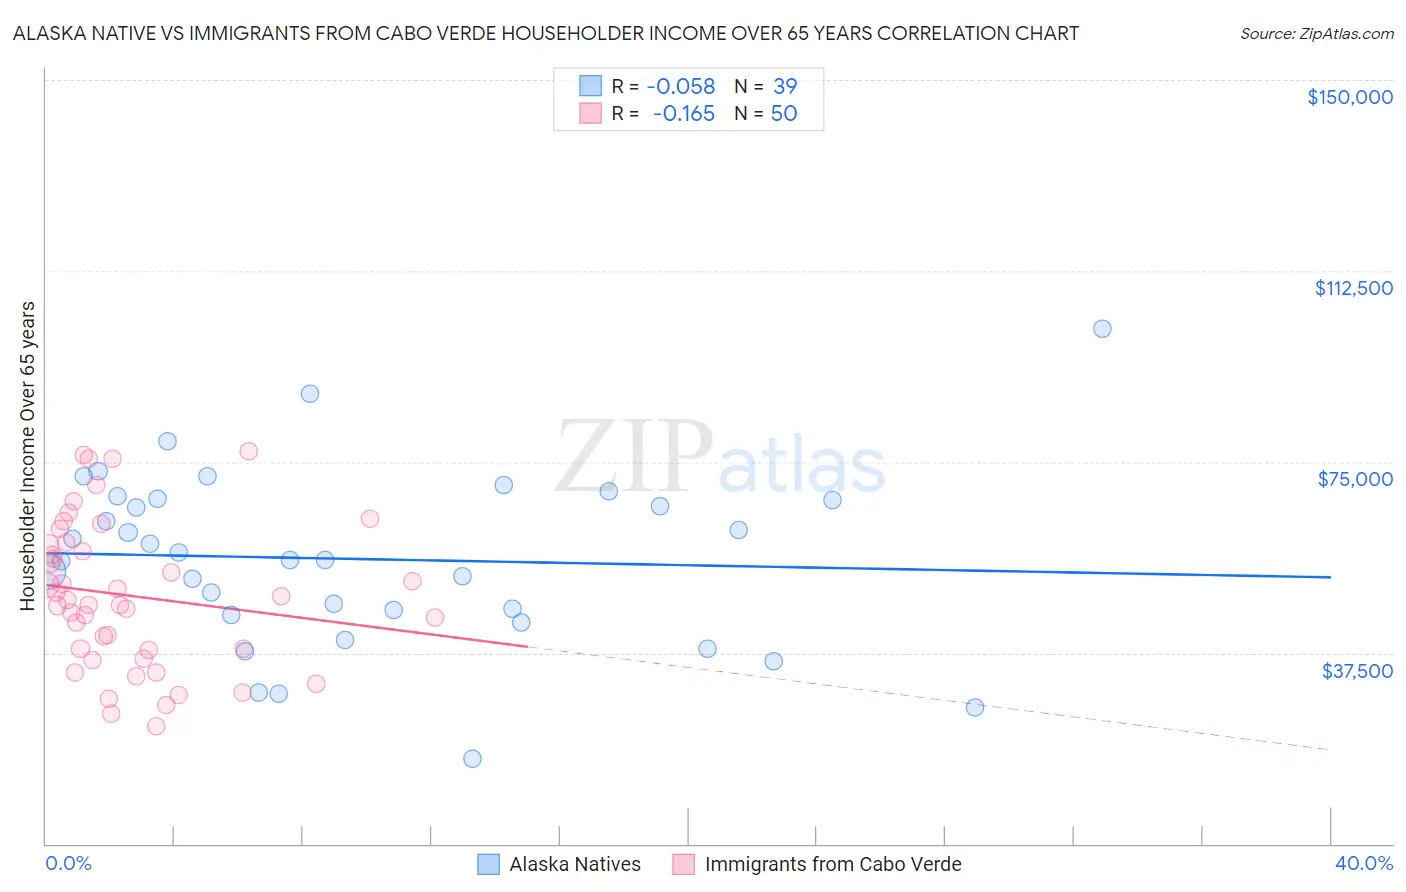
Alaska Native vs Immigrants from Cabo Verde Householder Income Over 65 years Correlation Chart
The statistical analysis conducted on geographies consisting of 76,616,982 people shows a slight negative correlation between the proportion of Alaska Natives and household income with householder over the age of 65 in the United States with a correlation coefficient (R) of -0.058 and weighted average of $60,748. Similarly, the statistical analysis conducted on geographies consisting of 38,089,205 people shows a poor negative correlation between the proportion of Immigrants from Cabo Verde and household income with householder over the age of 65 in the United States with a correlation coefficient (R) of -0.165 and weighted average of $46,654, a difference of 30.2%.
Householder Income Over 65 years Correlation Summary
| Measurement | Alaska Native | Immigrants from Cabo Verde |
| Minimum | $16,607 | $23,194 |
| Maximum | $101,250 | $77,002 |
| Range | $84,643 | $53,808 |
| Mean | $55,918 | $48,671 |
| Median | $55,808 | $47,365 |
| Interquartile 25% (IQ1) | $45,000 | $38,115 |
| Interquartile 75% (IQ3) | $67,644 | $58,879 |
| Interquartile Range (IQR) | $22,644 | $20,764 |
| Standard Deviation (Sample) | $17,265 | $14,326 |
| Standard Deviation (Population) | $17,043 | $14,182 |
Similar Demographics by Householder Income Over 65 years
Demographics Similar to Alaska Natives by Householder Income Over 65 years
In terms of householder income over 65 years, the demographic groups most similar to Alaska Natives are Yup'ik ($60,727, a difference of 0.030%), Spanish ($60,795, a difference of 0.080%), Welsh ($60,666, a difference of 0.14%), Immigrants from Morocco ($60,647, a difference of 0.17%), and Spaniard ($60,866, a difference of 0.19%).
| Demographics | Rating | Rank | Householder Income Over 65 years |
| Serbians | 53.1 /100 | #170 | Average $61,087 |
| Inupiat | 52.4 /100 | #171 | Average $61,061 |
| Immigrants | Poland | 51.9 /100 | #172 | Average $61,041 |
| Immigrants | Micronesia | 50.8 /100 | #173 | Average $61,000 |
| Luxembourgers | 50.0 /100 | #174 | Average $60,967 |
| Spaniards | 47.3 /100 | #175 | Average $60,866 |
| Spanish | 45.5 /100 | #176 | Average $60,795 |
| Alaska Natives | 44.3 /100 | #177 | Average $60,748 |
| Yup'ik | 43.7 /100 | #178 | Average $60,727 |
| Welsh | 42.2 /100 | #179 | Average $60,666 |
| Immigrants | Morocco | 41.7 /100 | #180 | Average $60,647 |
| Celtics | 40.7 /100 | #181 | Average $60,608 |
| Czechoslovakians | 40.0 /100 | #182 | Average $60,581 |
| Kenyans | 38.4 /100 | #183 | Fair $60,514 |
| Iraqis | 37.2 /100 | #184 | Fair $60,466 |
Demographics Similar to Immigrants from Cabo Verde by Householder Income Over 65 years
In terms of householder income over 65 years, the demographic groups most similar to Immigrants from Cabo Verde are Dominican ($46,964, a difference of 0.66%), Immigrants from Yemen ($47,527, a difference of 1.9%), Immigrants from Dominican Republic ($45,758, a difference of 2.0%), Navajo ($47,722, a difference of 2.3%), and Immigrants from Caribbean ($48,535, a difference of 4.0%).
| Demographics | Rating | Rank | Householder Income Over 65 years |
| Cape Verdeans | 0.0 /100 | #333 | Tragic $50,077 |
| Immigrants | Dominica | 0.0 /100 | #334 | Tragic $50,071 |
| Crow | 0.0 /100 | #335 | Tragic $49,234 |
| Cubans | 0.0 /100 | #336 | Tragic $49,152 |
| Tohono O'odham | 0.0 /100 | #337 | Tragic $49,121 |
| Immigrants | Caribbean | 0.0 /100 | #338 | Tragic $48,535 |
| Navajo | 0.0 /100 | #339 | Tragic $47,722 |
| Immigrants | Yemen | 0.0 /100 | #340 | Tragic $47,527 |
| Dominicans | 0.0 /100 | #341 | Tragic $46,964 |
| Immigrants | Cabo Verde | 0.0 /100 | #342 | Tragic $46,654 |
| Immigrants | Dominican Republic | 0.0 /100 | #343 | Tragic $45,758 |
| Houma | 0.0 /100 | #344 | Tragic $44,822 |
| Immigrants | Cuba | 0.0 /100 | #345 | Tragic $44,735 |
| Puerto Ricans | 0.0 /100 | #346 | Tragic $42,550 |
| Lumbee | 0.0 /100 | #347 | Tragic $40,550 |