Afghan vs Australian 1 or more Vehicles in Household
COMPARE
Afghan
Australian
1 or more Vehicles in Household
1 or more Vehicles in Household Comparison
Afghans
Australians
92.1%
1 OR MORE VEHICLES IN HOUSEHOLD
99.9/ 100
METRIC RATING
49th/ 347
METRIC RANK
90.0%
1 OR MORE VEHICLES IN HOUSEHOLD
72.4/ 100
METRIC RATING
156th/ 347
METRIC RANK
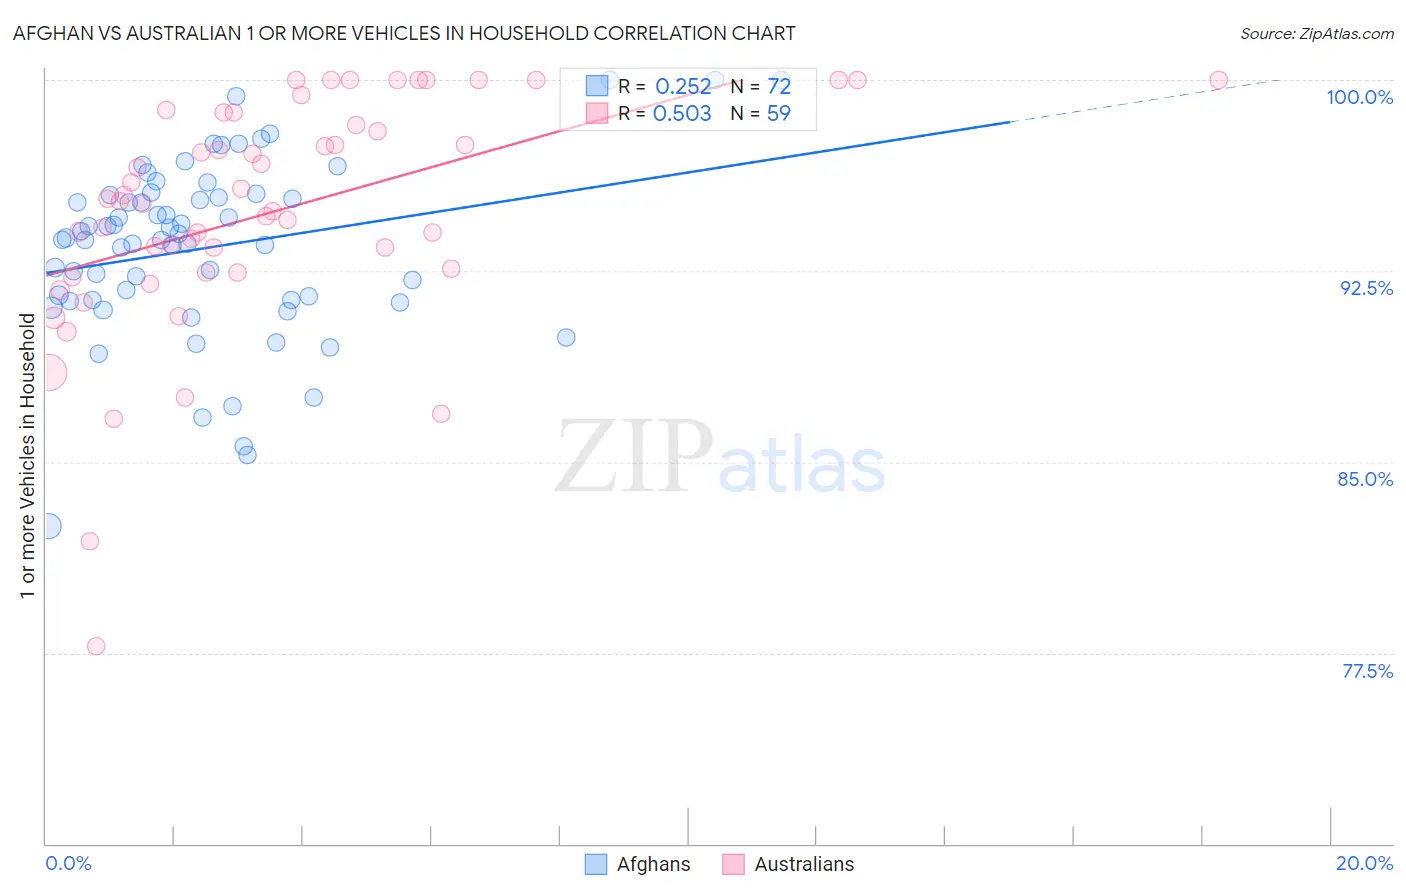
Afghan vs Australian 1 or more Vehicles in Household Correlation Chart
The statistical analysis conducted on geographies consisting of 148,819,650 people shows a weak positive correlation between the proportion of Afghans and percentage of households with 1 or more vehicles available in the United States with a correlation coefficient (R) of 0.252 and weighted average of 92.1%. Similarly, the statistical analysis conducted on geographies consisting of 224,001,878 people shows a substantial positive correlation between the proportion of Australians and percentage of households with 1 or more vehicles available in the United States with a correlation coefficient (R) of 0.503 and weighted average of 90.0%, a difference of 2.3%.
1 or more Vehicles in Household Correlation Summary
| Measurement | Afghan | Australian |
| Minimum | 82.5% | 77.7% |
| Maximum | 100.0% | 100.0% |
| Range | 17.5% | 22.3% |
| Mean | 93.4% | 94.8% |
| Median | 93.8% | 95.3% |
| Interquartile 25% (IQ1) | 91.3% | 92.4% |
| Interquartile 75% (IQ3) | 95.4% | 98.7% |
| Interquartile Range (IQR) | 4.1% | 6.3% |
| Standard Deviation (Sample) | 3.5% | 4.6% |
| Standard Deviation (Population) | 3.4% | 4.6% |
Similar Demographics by 1 or more Vehicles in Household
Demographics Similar to Afghans by 1 or more Vehicles in Household
In terms of 1 or more vehicles in household, the demographic groups most similar to Afghans are Belgian (92.1%, a difference of 0.010%), Guamanian/Chamorro (92.1%, a difference of 0.010%), Celtic (92.1%, a difference of 0.020%), Korean (92.1%, a difference of 0.050%), and Hawaiian (92.0%, a difference of 0.080%).
| Demographics | Rating | Rank | 1 or more Vehicles in Household |
| Chickasaw | 99.9 /100 | #42 | Exceptional 92.3% |
| Spanish | 99.9 /100 | #43 | Exceptional 92.3% |
| Choctaw | 99.9 /100 | #44 | Exceptional 92.2% |
| Immigrants | Nonimmigrants | 99.9 /100 | #45 | Exceptional 92.2% |
| Immigrants | Fiji | 99.9 /100 | #46 | Exceptional 92.2% |
| Northern Europeans | 99.9 /100 | #47 | Exceptional 92.2% |
| Belgians | 99.9 /100 | #48 | Exceptional 92.1% |
| Afghans | 99.9 /100 | #49 | Exceptional 92.1% |
| Guamanians/Chamorros | 99.9 /100 | #50 | Exceptional 92.1% |
| Celtics | 99.9 /100 | #51 | Exceptional 92.1% |
| Koreans | 99.9 /100 | #52 | Exceptional 92.1% |
| Hawaiians | 99.9 /100 | #53 | Exceptional 92.0% |
| Slovenes | 99.9 /100 | #54 | Exceptional 92.0% |
| Immigrants | Afghanistan | 99.9 /100 | #55 | Exceptional 92.0% |
| Immigrants | Venezuela | 99.9 /100 | #56 | Exceptional 92.0% |
Demographics Similar to Australians by 1 or more Vehicles in Household
In terms of 1 or more vehicles in household, the demographic groups most similar to Australians are Immigrants (90.1%, a difference of 0.020%), Immigrants from Congo (90.0%, a difference of 0.020%), New Zealander (90.1%, a difference of 0.030%), Immigrants from Uganda (90.1%, a difference of 0.030%), and Brazilian (90.0%, a difference of 0.030%).
| Demographics | Rating | Rank | 1 or more Vehicles in Household |
| Immigrants | Nicaragua | 76.7 /100 | #149 | Good 90.1% |
| Immigrants | Micronesia | 75.9 /100 | #150 | Good 90.1% |
| Immigrants | Bosnia and Herzegovina | 75.4 /100 | #151 | Good 90.1% |
| Tlingit-Haida | 74.3 /100 | #152 | Good 90.1% |
| New Zealanders | 73.8 /100 | #153 | Good 90.1% |
| Immigrants | Uganda | 73.8 /100 | #154 | Good 90.1% |
| Immigrants | Immigrants | 73.6 /100 | #155 | Good 90.1% |
| Australians | 72.4 /100 | #156 | Good 90.0% |
| Immigrants | Congo | 71.2 /100 | #157 | Good 90.0% |
| Brazilians | 71.0 /100 | #158 | Good 90.0% |
| South Africans | 69.7 /100 | #159 | Good 90.0% |
| Immigrants | Indonesia | 68.8 /100 | #160 | Good 90.0% |
| Salvadorans | 68.7 /100 | #161 | Good 90.0% |
| Spanish American Indians | 67.0 /100 | #162 | Good 89.9% |
| Immigrants | Austria | 65.5 /100 | #163 | Good 89.9% |