Afghan vs French 1 or more Vehicles in Household
COMPARE
Afghan
French
1 or more Vehicles in Household
1 or more Vehicles in Household Comparison
Afghans
French
92.1%
1 OR MORE VEHICLES IN HOUSEHOLD
99.9/ 100
METRIC RATING
49th/ 347
METRIC RANK
92.7%
1 OR MORE VEHICLES IN HOUSEHOLD
100.0/ 100
METRIC RATING
22nd/ 347
METRIC RANK
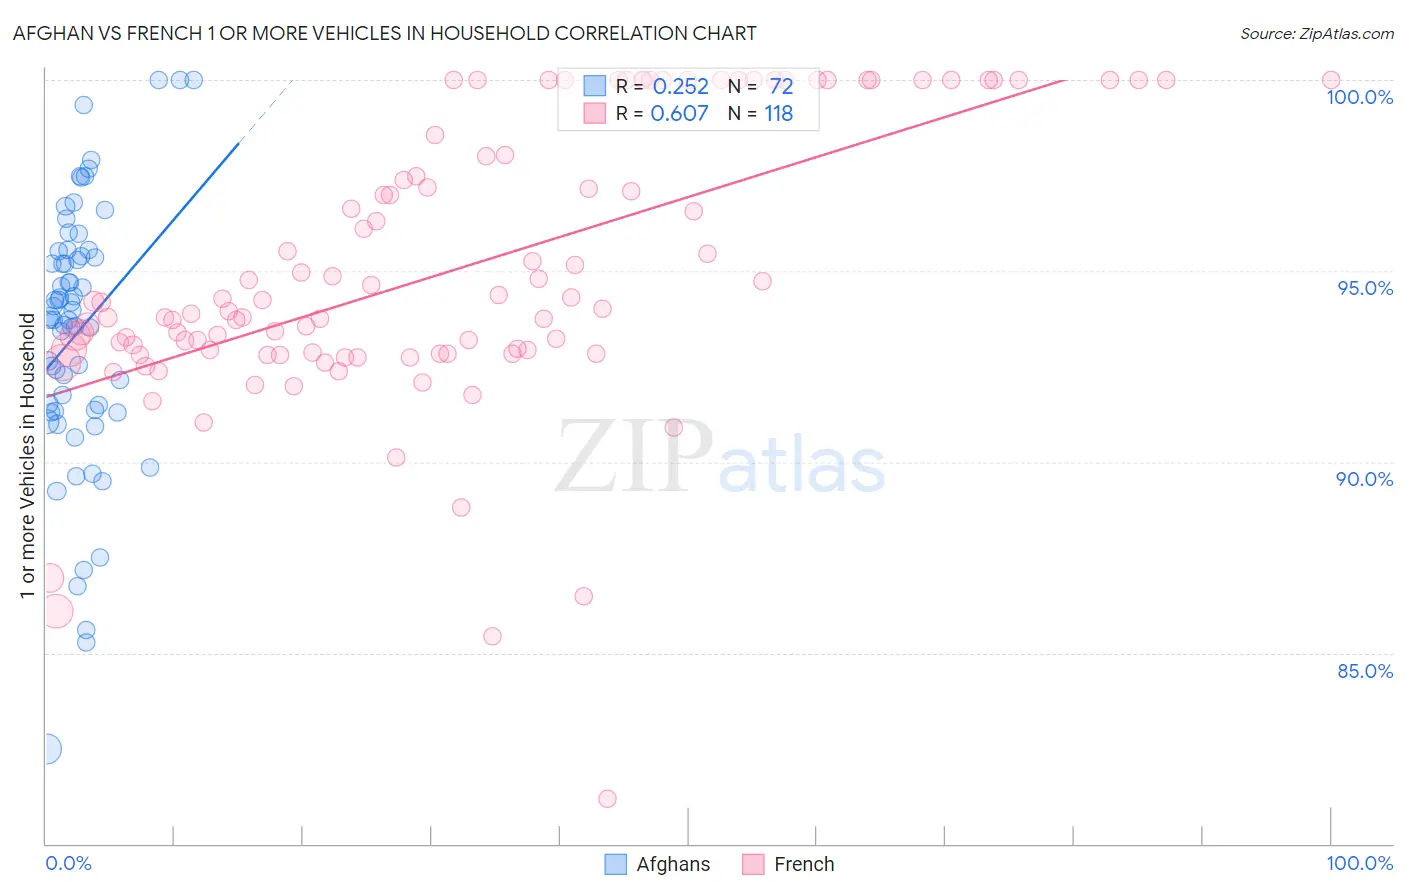
Afghan vs French 1 or more Vehicles in Household Correlation Chart
The statistical analysis conducted on geographies consisting of 148,819,650 people shows a weak positive correlation between the proportion of Afghans and percentage of households with 1 or more vehicles available in the United States with a correlation coefficient (R) of 0.252 and weighted average of 92.1%. Similarly, the statistical analysis conducted on geographies consisting of 571,913,868 people shows a significant positive correlation between the proportion of French and percentage of households with 1 or more vehicles available in the United States with a correlation coefficient (R) of 0.607 and weighted average of 92.7%, a difference of 0.62%.
1 or more Vehicles in Household Correlation Summary
| Measurement | Afghan | French |
| Minimum | 82.5% | 81.2% |
| Maximum | 100.0% | 100.0% |
| Range | 17.5% | 18.8% |
| Mean | 93.4% | 95.0% |
| Median | 93.8% | 94.1% |
| Interquartile 25% (IQ1) | 91.3% | 92.8% |
| Interquartile 75% (IQ3) | 95.4% | 98.6% |
| Interquartile Range (IQR) | 4.1% | 5.7% |
| Standard Deviation (Sample) | 3.5% | 3.7% |
| Standard Deviation (Population) | 3.4% | 3.7% |
Similar Demographics by 1 or more Vehicles in Household
Demographics Similar to Afghans by 1 or more Vehicles in Household
In terms of 1 or more vehicles in household, the demographic groups most similar to Afghans are Belgian (92.1%, a difference of 0.010%), Guamanian/Chamorro (92.1%, a difference of 0.010%), Celtic (92.1%, a difference of 0.020%), Korean (92.1%, a difference of 0.050%), and Hawaiian (92.0%, a difference of 0.080%).
| Demographics | Rating | Rank | 1 or more Vehicles in Household |
| Chickasaw | 99.9 /100 | #42 | Exceptional 92.3% |
| Spanish | 99.9 /100 | #43 | Exceptional 92.3% |
| Choctaw | 99.9 /100 | #44 | Exceptional 92.2% |
| Immigrants | Nonimmigrants | 99.9 /100 | #45 | Exceptional 92.2% |
| Immigrants | Fiji | 99.9 /100 | #46 | Exceptional 92.2% |
| Northern Europeans | 99.9 /100 | #47 | Exceptional 92.2% |
| Belgians | 99.9 /100 | #48 | Exceptional 92.1% |
| Afghans | 99.9 /100 | #49 | Exceptional 92.1% |
| Guamanians/Chamorros | 99.9 /100 | #50 | Exceptional 92.1% |
| Celtics | 99.9 /100 | #51 | Exceptional 92.1% |
| Koreans | 99.9 /100 | #52 | Exceptional 92.1% |
| Hawaiians | 99.9 /100 | #53 | Exceptional 92.0% |
| Slovenes | 99.9 /100 | #54 | Exceptional 92.0% |
| Immigrants | Afghanistan | 99.9 /100 | #55 | Exceptional 92.0% |
| Immigrants | Venezuela | 99.9 /100 | #56 | Exceptional 92.0% |
Demographics Similar to French by 1 or more Vehicles in Household
In terms of 1 or more vehicles in household, the demographic groups most similar to French are Ottawa (92.7%, a difference of 0.010%), Arapaho (92.7%, a difference of 0.030%), Nepalese (92.6%, a difference of 0.070%), Yaqui (92.6%, a difference of 0.14%), and Immigrants from Iraq (92.5%, a difference of 0.16%).
| Demographics | Rating | Rank | 1 or more Vehicles in Household |
| Mexicans | 100.0 /100 | #15 | Exceptional 93.0% |
| Assyrians/Chaldeans/Syriacs | 100.0 /100 | #16 | Exceptional 93.0% |
| Europeans | 100.0 /100 | #17 | Exceptional 93.0% |
| Welsh | 100.0 /100 | #18 | Exceptional 93.0% |
| Tongans | 100.0 /100 | #19 | Exceptional 92.9% |
| Arapaho | 100.0 /100 | #20 | Exceptional 92.7% |
| Ottawa | 100.0 /100 | #21 | Exceptional 92.7% |
| French | 100.0 /100 | #22 | Exceptional 92.7% |
| Nepalese | 100.0 /100 | #23 | Exceptional 92.6% |
| Yaqui | 100.0 /100 | #24 | Exceptional 92.6% |
| Immigrants | Iraq | 100.0 /100 | #25 | Exceptional 92.5% |
| British | 100.0 /100 | #26 | Exceptional 92.5% |
| Americans | 100.0 /100 | #27 | Exceptional 92.5% |
| Sri Lankans | 100.0 /100 | #28 | Exceptional 92.5% |
| Native Hawaiians | 100.0 /100 | #29 | Exceptional 92.4% |