Immigrants from Western Africa vs Immigrants from Belgium Unemployment
COMPARE
Immigrants from Western Africa
Immigrants from Belgium
Unemployment
Unemployment Comparison
Immigrants from Western Africa
Immigrants from Belgium
6.0%
UNEMPLOYMENT
0.0/ 100
METRIC RATING
280th/ 347
METRIC RANK
4.9%
UNEMPLOYMENT
99.2/ 100
METRIC RATING
51st/ 347
METRIC RANK
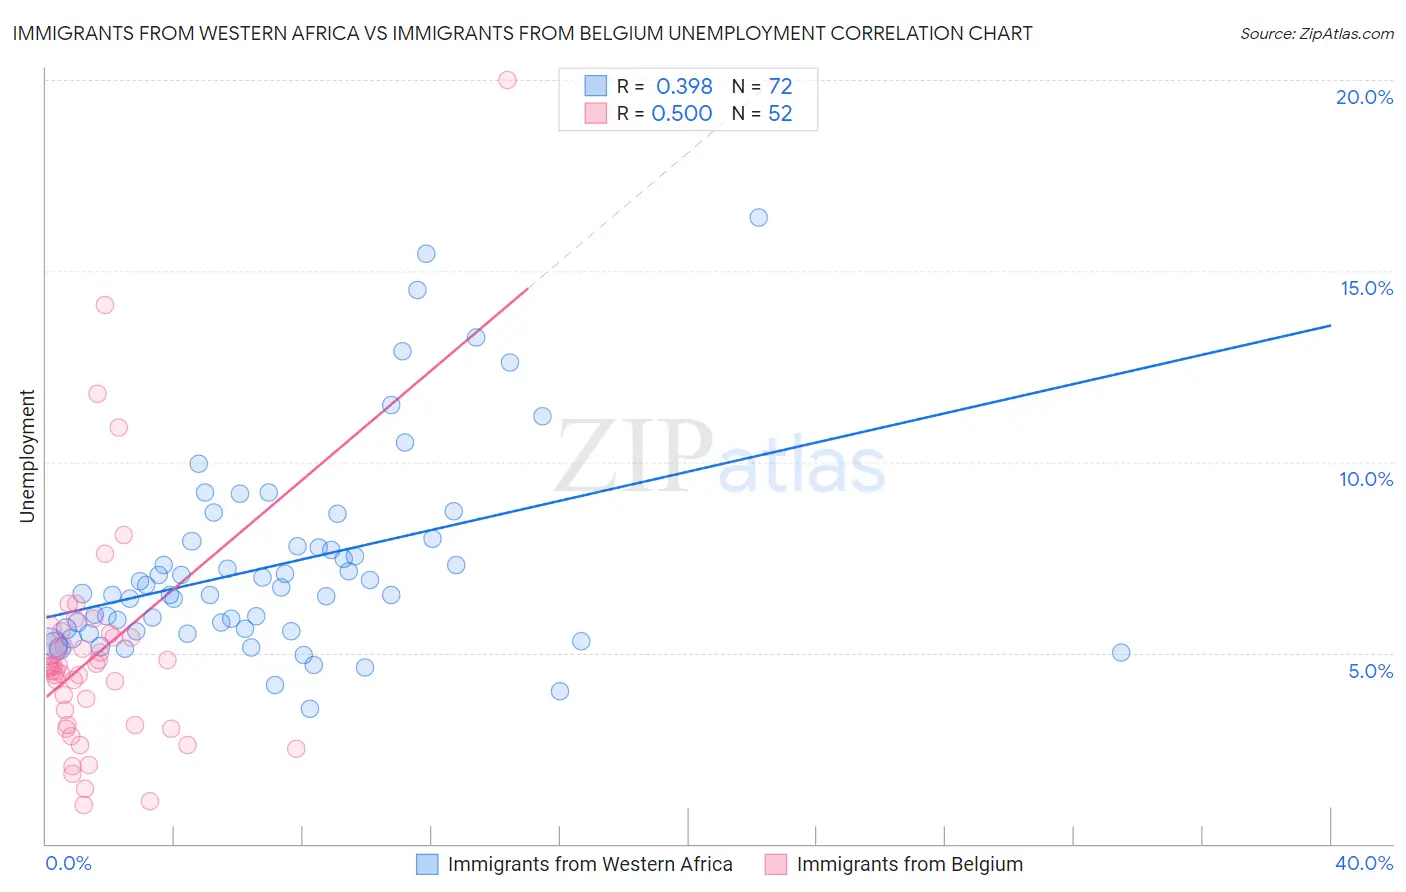
Immigrants from Western Africa vs Immigrants from Belgium Unemployment Correlation Chart
The statistical analysis conducted on geographies consisting of 357,683,143 people shows a mild positive correlation between the proportion of Immigrants from Western Africa and unemployment in the United States with a correlation coefficient (R) of 0.398 and weighted average of 6.0%. Similarly, the statistical analysis conducted on geographies consisting of 146,688,152 people shows a substantial positive correlation between the proportion of Immigrants from Belgium and unemployment in the United States with a correlation coefficient (R) of 0.500 and weighted average of 4.9%, a difference of 23.7%.
Unemployment Correlation Summary
| Measurement | Immigrants from Western Africa | Immigrants from Belgium |
| Minimum | 3.5% | 1.0% |
| Maximum | 16.4% | 20.0% |
| Range | 12.9% | 19.0% |
| Mean | 7.3% | 5.0% |
| Median | 6.5% | 4.6% |
| Interquartile 25% (IQ1) | 5.6% | 3.1% |
| Interquartile 75% (IQ3) | 7.9% | 5.4% |
| Interquartile Range (IQR) | 2.3% | 2.3% |
| Standard Deviation (Sample) | 2.7% | 3.2% |
| Standard Deviation (Population) | 2.6% | 3.2% |
Similar Demographics by Unemployment
Demographics Similar to Immigrants from Western Africa by Unemployment
In terms of unemployment, the demographic groups most similar to Immigrants from Western Africa are Immigrants from Mexico (6.0%, a difference of 0.0%), Ghanaian (6.0%, a difference of 0.43%), African (6.1%, a difference of 0.58%), Immigrants from the Azores (6.1%, a difference of 0.64%), and Armenian (6.0%, a difference of 0.73%).
| Demographics | Rating | Rank | Unemployment |
| Immigrants | Fiji | 0.0 /100 | #273 | Tragic 5.9% |
| Bahamians | 0.0 /100 | #274 | Tragic 5.9% |
| Immigrants | Latin America | 0.0 /100 | #275 | Tragic 5.9% |
| Immigrants | Central America | 0.0 /100 | #276 | Tragic 6.0% |
| Armenians | 0.0 /100 | #277 | Tragic 6.0% |
| Ghanaians | 0.0 /100 | #278 | Tragic 6.0% |
| Immigrants | Mexico | 0.0 /100 | #279 | Tragic 6.0% |
| Immigrants | Western Africa | 0.0 /100 | #280 | Tragic 6.0% |
| Africans | 0.0 /100 | #281 | Tragic 6.1% |
| Immigrants | Azores | 0.0 /100 | #282 | Tragic 6.1% |
| Immigrants | Ghana | 0.0 /100 | #283 | Tragic 6.1% |
| Aleuts | 0.0 /100 | #284 | Tragic 6.1% |
| Immigrants | Senegal | 0.0 /100 | #285 | Tragic 6.1% |
| Immigrants | Caribbean | 0.0 /100 | #286 | Tragic 6.2% |
| Nepalese | 0.0 /100 | #287 | Tragic 6.2% |
Demographics Similar to Immigrants from Belgium by Unemployment
In terms of unemployment, the demographic groups most similar to Immigrants from Belgium are White/Caucasian (4.9%, a difference of 0.010%), Immigrants from Zimbabwe (4.9%, a difference of 0.040%), Eastern European (4.9%, a difference of 0.070%), Australian (4.9%, a difference of 0.10%), and French Canadian (4.9%, a difference of 0.16%).
| Demographics | Rating | Rank | Unemployment |
| Austrians | 99.5 /100 | #44 | Exceptional 4.8% |
| French | 99.5 /100 | #45 | Exceptional 4.8% |
| Immigrants | Nepal | 99.4 /100 | #46 | Exceptional 4.8% |
| Immigrants | Taiwan | 99.4 /100 | #47 | Exceptional 4.8% |
| Immigrants | Scotland | 99.3 /100 | #48 | Exceptional 4.9% |
| Immigrants | South Central Asia | 99.3 /100 | #49 | Exceptional 4.9% |
| French Canadians | 99.3 /100 | #50 | Exceptional 4.9% |
| Immigrants | Belgium | 99.2 /100 | #51 | Exceptional 4.9% |
| Whites/Caucasians | 99.2 /100 | #52 | Exceptional 4.9% |
| Immigrants | Zimbabwe | 99.2 /100 | #53 | Exceptional 4.9% |
| Eastern Europeans | 99.2 /100 | #54 | Exceptional 4.9% |
| Australians | 99.2 /100 | #55 | Exceptional 4.9% |
| Celtics | 99.1 /100 | #56 | Exceptional 4.9% |
| Immigrants | Singapore | 99.1 /100 | #57 | Exceptional 4.9% |
| Greeks | 99.0 /100 | #58 | Exceptional 4.9% |