Immigrants from Jordan vs Immigrants from Belgium Unemployment
COMPARE
Immigrants from Jordan
Immigrants from Belgium
Unemployment
Unemployment Comparison
Immigrants from Jordan
Immigrants from Belgium
5.1%
UNEMPLOYMENT
86.6/ 100
METRIC RATING
133rd/ 347
METRIC RANK
4.9%
UNEMPLOYMENT
99.2/ 100
METRIC RATING
51st/ 347
METRIC RANK
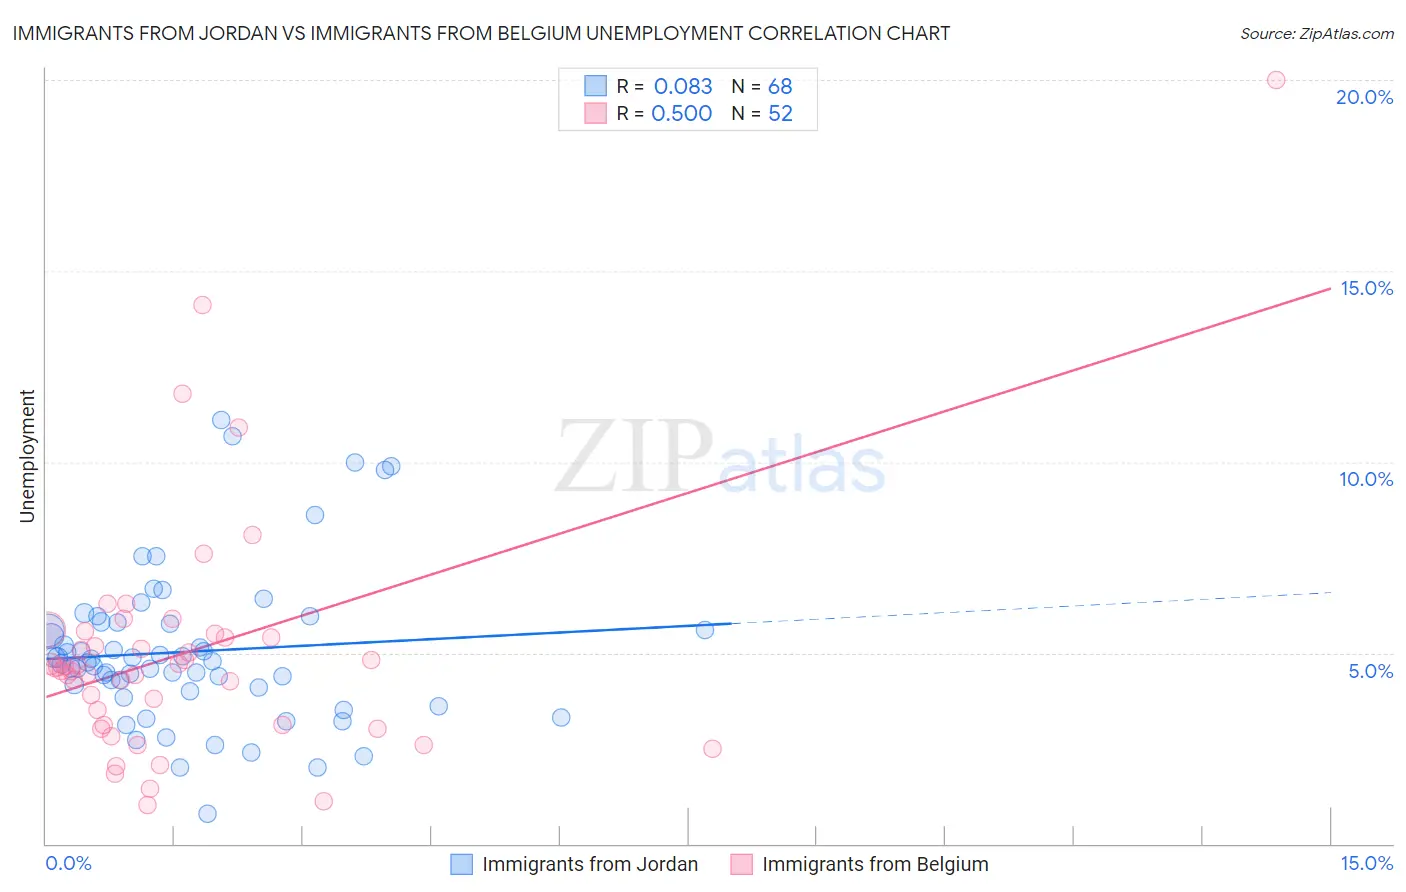
Immigrants from Jordan vs Immigrants from Belgium Unemployment Correlation Chart
The statistical analysis conducted on geographies consisting of 181,256,690 people shows a slight positive correlation between the proportion of Immigrants from Jordan and unemployment in the United States with a correlation coefficient (R) of 0.083 and weighted average of 5.1%. Similarly, the statistical analysis conducted on geographies consisting of 146,688,152 people shows a substantial positive correlation between the proportion of Immigrants from Belgium and unemployment in the United States with a correlation coefficient (R) of 0.500 and weighted average of 4.9%, a difference of 5.0%.
Unemployment Correlation Summary
| Measurement | Immigrants from Jordan | Immigrants from Belgium |
| Minimum | 0.80% | 1.0% |
| Maximum | 11.1% | 20.0% |
| Range | 10.3% | 19.0% |
| Mean | 5.0% | 5.0% |
| Median | 4.7% | 4.6% |
| Interquartile 25% (IQ1) | 4.1% | 3.1% |
| Interquartile 75% (IQ3) | 5.8% | 5.4% |
| Interquartile Range (IQR) | 1.7% | 2.3% |
| Standard Deviation (Sample) | 2.0% | 3.2% |
| Standard Deviation (Population) | 2.0% | 3.2% |
Similar Demographics by Unemployment
Demographics Similar to Immigrants from Jordan by Unemployment
In terms of unemployment, the demographic groups most similar to Immigrants from Jordan are Immigrants from Ethiopia (5.1%, a difference of 0.010%), Immigrants from Croatia (5.1%, a difference of 0.020%), Iranian (5.1%, a difference of 0.040%), Immigrants from Europe (5.1%, a difference of 0.040%), and Immigrants from Burma/Myanmar (5.1%, a difference of 0.050%).
| Demographics | Rating | Rank | Unemployment |
| Kenyans | 88.2 /100 | #126 | Excellent 5.1% |
| Immigrants | Kenya | 88.2 /100 | #127 | Excellent 5.1% |
| Immigrants | Eastern Africa | 88.1 /100 | #128 | Excellent 5.1% |
| Immigrants | Latvia | 88.0 /100 | #129 | Excellent 5.1% |
| Iranians | 86.9 /100 | #130 | Excellent 5.1% |
| Immigrants | Croatia | 86.8 /100 | #131 | Excellent 5.1% |
| Immigrants | Ethiopia | 86.7 /100 | #132 | Excellent 5.1% |
| Immigrants | Jordan | 86.6 /100 | #133 | Excellent 5.1% |
| Immigrants | Europe | 86.3 /100 | #134 | Excellent 5.1% |
| Immigrants | Burma/Myanmar | 86.2 /100 | #135 | Excellent 5.1% |
| Immigrants | Spain | 86.2 /100 | #136 | Excellent 5.1% |
| Immigrants | Saudi Arabia | 85.6 /100 | #137 | Excellent 5.1% |
| Immigrants | Hungary | 85.6 /100 | #138 | Excellent 5.1% |
| Pakistanis | 85.3 /100 | #139 | Excellent 5.1% |
| Immigrants | Denmark | 84.3 /100 | #140 | Excellent 5.1% |
Demographics Similar to Immigrants from Belgium by Unemployment
In terms of unemployment, the demographic groups most similar to Immigrants from Belgium are White/Caucasian (4.9%, a difference of 0.010%), Immigrants from Zimbabwe (4.9%, a difference of 0.040%), Eastern European (4.9%, a difference of 0.070%), Australian (4.9%, a difference of 0.10%), and French Canadian (4.9%, a difference of 0.16%).
| Demographics | Rating | Rank | Unemployment |
| Austrians | 99.5 /100 | #44 | Exceptional 4.8% |
| French | 99.5 /100 | #45 | Exceptional 4.8% |
| Immigrants | Nepal | 99.4 /100 | #46 | Exceptional 4.8% |
| Immigrants | Taiwan | 99.4 /100 | #47 | Exceptional 4.8% |
| Immigrants | Scotland | 99.3 /100 | #48 | Exceptional 4.9% |
| Immigrants | South Central Asia | 99.3 /100 | #49 | Exceptional 4.9% |
| French Canadians | 99.3 /100 | #50 | Exceptional 4.9% |
| Immigrants | Belgium | 99.2 /100 | #51 | Exceptional 4.9% |
| Whites/Caucasians | 99.2 /100 | #52 | Exceptional 4.9% |
| Immigrants | Zimbabwe | 99.2 /100 | #53 | Exceptional 4.9% |
| Eastern Europeans | 99.2 /100 | #54 | Exceptional 4.9% |
| Australians | 99.2 /100 | #55 | Exceptional 4.9% |
| Celtics | 99.1 /100 | #56 | Exceptional 4.9% |
| Immigrants | Singapore | 99.1 /100 | #57 | Exceptional 4.9% |
| Greeks | 99.0 /100 | #58 | Exceptional 4.9% |