Yugoslavian vs Immigrants from Belgium Disability
COMPARE
Yugoslavian
Immigrants from Belgium
Disability
Disability Comparison
Yugoslavians
Immigrants from Belgium
12.2%
DISABILITY
1.7/ 100
METRIC RATING
241st/ 347
METRIC RANK
11.0%
DISABILITY
99.3/ 100
METRIC RATING
77th/ 347
METRIC RANK
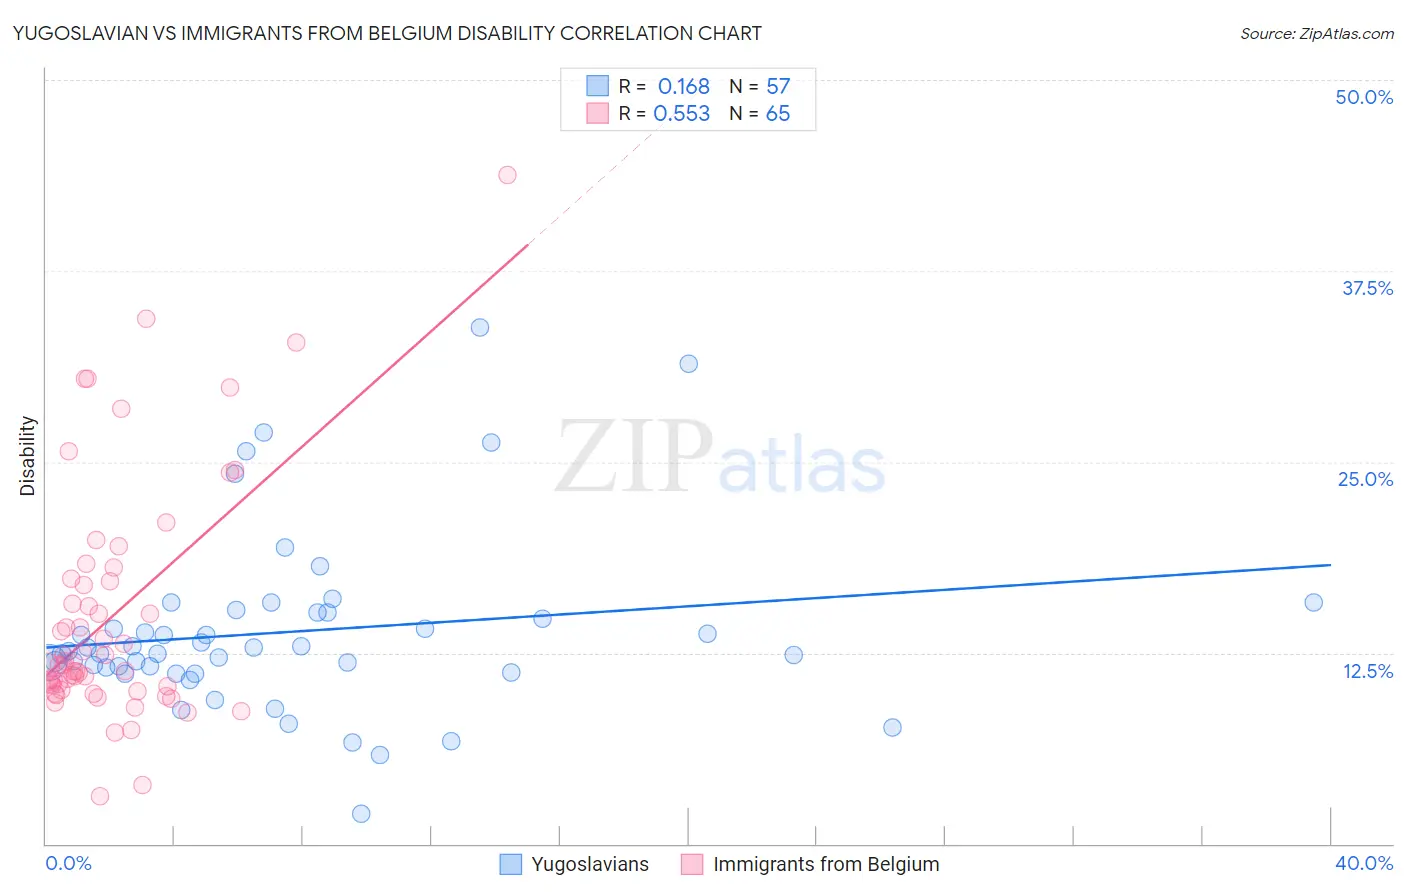
Yugoslavian vs Immigrants from Belgium Disability Correlation Chart
The statistical analysis conducted on geographies consisting of 285,695,841 people shows a poor positive correlation between the proportion of Yugoslavians and percentage of population with a disability in the United States with a correlation coefficient (R) of 0.168 and weighted average of 12.2%. Similarly, the statistical analysis conducted on geographies consisting of 146,717,814 people shows a substantial positive correlation between the proportion of Immigrants from Belgium and percentage of population with a disability in the United States with a correlation coefficient (R) of 0.553 and weighted average of 11.0%, a difference of 10.6%.
Disability Correlation Summary
| Measurement | Yugoslavian | Immigrants from Belgium |
| Minimum | 2.0% | 3.1% |
| Maximum | 33.8% | 43.8% |
| Range | 31.8% | 40.7% |
| Mean | 13.9% | 14.9% |
| Median | 12.6% | 11.7% |
| Interquartile 25% (IQ1) | 11.4% | 10.2% |
| Interquartile 75% (IQ3) | 15.1% | 17.3% |
| Interquartile Range (IQR) | 3.8% | 7.1% |
| Standard Deviation (Sample) | 5.8% | 7.8% |
| Standard Deviation (Population) | 5.8% | 7.7% |
Similar Demographics by Disability
Demographics Similar to Yugoslavians by Disability
In terms of disability, the demographic groups most similar to Yugoslavians are Hungarian (12.2%, a difference of 0.0%), Polish (12.2%, a difference of 0.020%), Swedish (12.2%, a difference of 0.050%), Norwegian (12.2%, a difference of 0.090%), and British (12.2%, a difference of 0.11%).
| Demographics | Rating | Rank | Disability |
| Japanese | 2.3 /100 | #234 | Tragic 12.2% |
| Yup'ik | 2.2 /100 | #235 | Tragic 12.2% |
| Chinese | 2.0 /100 | #236 | Tragic 12.2% |
| Immigrants | Congo | 1.9 /100 | #237 | Tragic 12.2% |
| Norwegians | 1.9 /100 | #238 | Tragic 12.2% |
| Swedes | 1.8 /100 | #239 | Tragic 12.2% |
| Hungarians | 1.7 /100 | #240 | Tragic 12.2% |
| Yugoslavians | 1.7 /100 | #241 | Tragic 12.2% |
| Poles | 1.7 /100 | #242 | Tragic 12.2% |
| British | 1.5 /100 | #243 | Tragic 12.2% |
| Basques | 1.5 /100 | #244 | Tragic 12.2% |
| Liberians | 1.5 /100 | #245 | Tragic 12.2% |
| Swiss | 1.5 /100 | #246 | Tragic 12.2% |
| Indonesians | 1.4 /100 | #247 | Tragic 12.2% |
| Guamanians/Chamorros | 1.4 /100 | #248 | Tragic 12.3% |
Demographics Similar to Immigrants from Belgium by Disability
In terms of disability, the demographic groups most similar to Immigrants from Belgium are Sierra Leonean (11.0%, a difference of 0.0%), Immigrants from Vietnam (11.0%, a difference of 0.030%), Immigrants from Cameroon (11.1%, a difference of 0.040%), Immigrants from Serbia (11.0%, a difference of 0.050%), and Immigrants from Bangladesh (11.0%, a difference of 0.070%).
| Demographics | Rating | Rank | Disability |
| Immigrants | France | 99.4 /100 | #70 | Exceptional 11.0% |
| Immigrants | Lebanon | 99.4 /100 | #71 | Exceptional 11.0% |
| Immigrants | Chile | 99.4 /100 | #72 | Exceptional 11.0% |
| Immigrants | Bangladesh | 99.4 /100 | #73 | Exceptional 11.0% |
| Immigrants | Serbia | 99.4 /100 | #74 | Exceptional 11.0% |
| Immigrants | Vietnam | 99.4 /100 | #75 | Exceptional 11.0% |
| Sierra Leoneans | 99.3 /100 | #76 | Exceptional 11.0% |
| Immigrants | Belgium | 99.3 /100 | #77 | Exceptional 11.0% |
| Immigrants | Cameroon | 99.3 /100 | #78 | Exceptional 11.1% |
| Immigrants | Jordan | 99.3 /100 | #79 | Exceptional 11.1% |
| Immigrants | Ireland | 99.3 /100 | #80 | Exceptional 11.1% |
| Immigrants | Poland | 99.1 /100 | #81 | Exceptional 11.1% |
| Chileans | 99.1 /100 | #82 | Exceptional 11.1% |
| Immigrants | Switzerland | 99.0 /100 | #83 | Exceptional 11.1% |
| Immigrants | Sierra Leone | 99.0 /100 | #84 | Exceptional 11.1% |