White/Caucasian vs Albanian Unemployment Among Seniors over 75 years
COMPARE
White/Caucasian
Albanian
Unemployment Among Seniors over 75 years
Unemployment Among Seniors over 75 years Comparison
Whites/Caucasians
Albanians
10.1%
UNEMPLOYMENT AMONG SENIORS OVER 75 YEARS
0.0/ 100
METRIC RATING
308th/ 347
METRIC RANK
8.6%
UNEMPLOYMENT AMONG SENIORS OVER 75 YEARS
72.8/ 100
METRIC RATING
161st/ 347
METRIC RANK
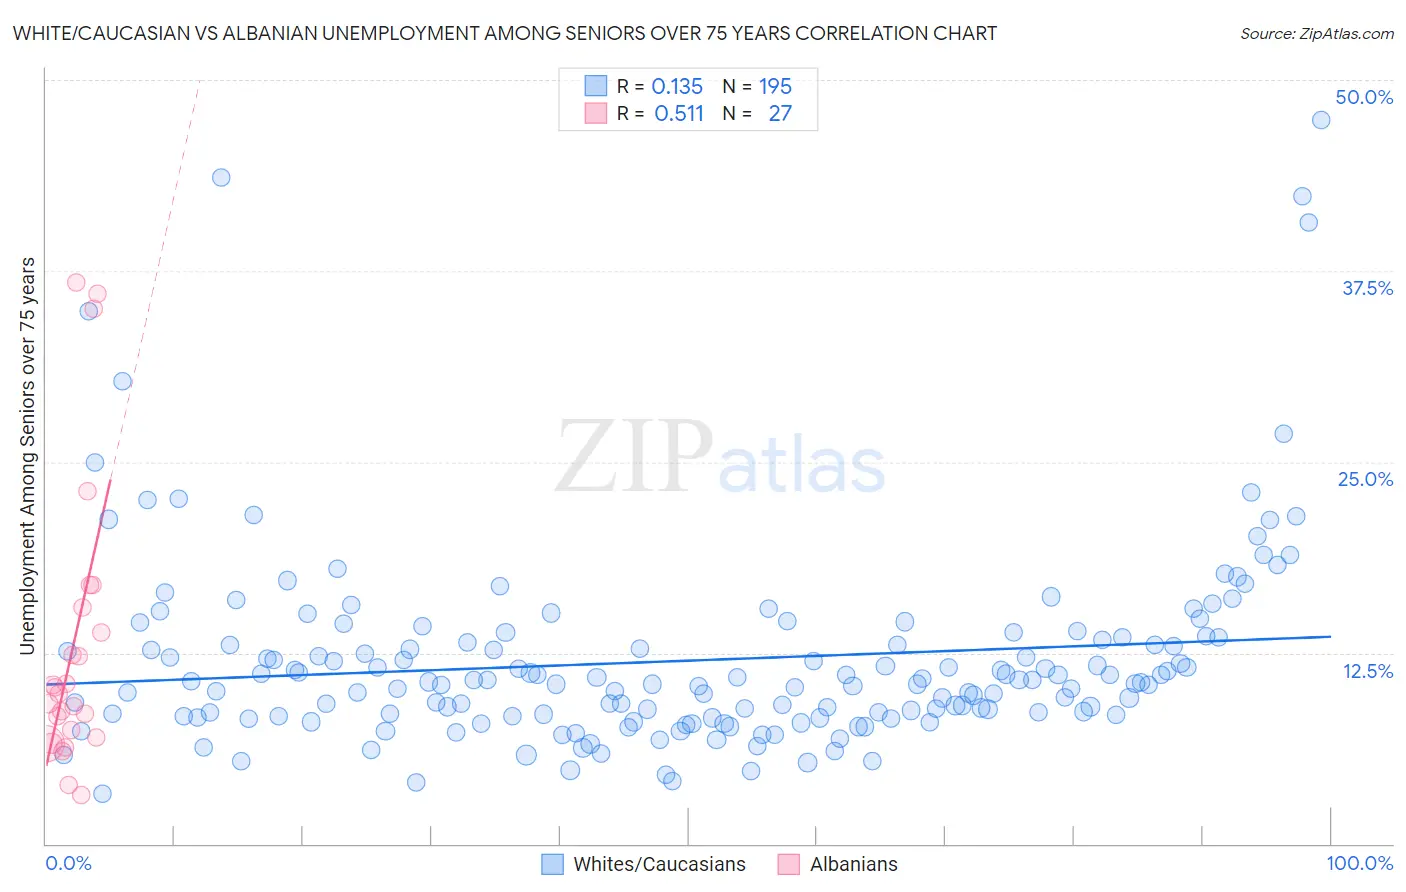
White/Caucasian vs Albanian Unemployment Among Seniors over 75 years Correlation Chart
The statistical analysis conducted on geographies consisting of 235,408,651 people shows a poor positive correlation between the proportion of Whites/Caucasians and unemployment rate among seniors over the age of 75 in the United States with a correlation coefficient (R) of 0.135 and weighted average of 10.1%. Similarly, the statistical analysis conducted on geographies consisting of 122,641,631 people shows a substantial positive correlation between the proportion of Albanians and unemployment rate among seniors over the age of 75 in the United States with a correlation coefficient (R) of 0.511 and weighted average of 8.6%, a difference of 16.6%.
Unemployment Among Seniors over 75 years Correlation Summary
| Measurement | White/Caucasian | Albanian |
| Minimum | 3.3% | 3.2% |
| Maximum | 47.4% | 36.8% |
| Range | 44.1% | 33.5% |
| Mean | 12.0% | 13.0% |
| Median | 10.6% | 9.8% |
| Interquartile 25% (IQ1) | 8.4% | 6.9% |
| Interquartile 75% (IQ3) | 13.4% | 15.4% |
| Interquartile Range (IQR) | 5.0% | 8.5% |
| Standard Deviation (Sample) | 6.5% | 9.3% |
| Standard Deviation (Population) | 6.5% | 9.2% |
Similar Demographics by Unemployment Among Seniors over 75 years
Demographics Similar to Whites/Caucasians by Unemployment Among Seniors over 75 years
In terms of unemployment among seniors over 75 years, the demographic groups most similar to Whites/Caucasians are English (10.1%, a difference of 0.070%), Hungarian (10.1%, a difference of 0.25%), Scottish (10.1%, a difference of 0.37%), Chippewa (10.1%, a difference of 0.38%), and Immigrants from Fiji (10.0%, a difference of 0.44%).
| Demographics | Rating | Rank | Unemployment Among Seniors over 75 years |
| Welsh | 0.0 /100 | #301 | Tragic 10.0% |
| Finns | 0.0 /100 | #302 | Tragic 10.0% |
| Puget Sound Salish | 0.0 /100 | #303 | Tragic 10.0% |
| Scotch-Irish | 0.0 /100 | #304 | Tragic 10.0% |
| Swedes | 0.0 /100 | #305 | Tragic 10.0% |
| Italians | 0.0 /100 | #306 | Tragic 10.0% |
| Immigrants | Fiji | 0.0 /100 | #307 | Tragic 10.0% |
| Whites/Caucasians | 0.0 /100 | #308 | Tragic 10.1% |
| English | 0.0 /100 | #309 | Tragic 10.1% |
| Hungarians | 0.0 /100 | #310 | Tragic 10.1% |
| Scottish | 0.0 /100 | #311 | Tragic 10.1% |
| Chippewa | 0.0 /100 | #312 | Tragic 10.1% |
| Nepalese | 0.0 /100 | #313 | Tragic 10.1% |
| Dutch West Indians | 0.0 /100 | #314 | Tragic 10.2% |
| Pennsylvania Germans | 0.0 /100 | #315 | Tragic 10.2% |
Demographics Similar to Albanians by Unemployment Among Seniors over 75 years
In terms of unemployment among seniors over 75 years, the demographic groups most similar to Albanians are Cree (8.6%, a difference of 0.0%), Immigrants from South America (8.6%, a difference of 0.10%), Shoshone (8.6%, a difference of 0.13%), Ethiopian (8.6%, a difference of 0.17%), and Immigrants from Bahamas (8.6%, a difference of 0.26%).
| Demographics | Rating | Rank | Unemployment Among Seniors over 75 years |
| Immigrants | Pakistan | 79.7 /100 | #154 | Good 8.6% |
| Ecuadorians | 78.5 /100 | #155 | Good 8.6% |
| Immigrants | Bahamas | 76.5 /100 | #156 | Good 8.6% |
| Turks | 76.4 /100 | #157 | Good 8.6% |
| Ethiopians | 75.3 /100 | #158 | Good 8.6% |
| Shoshone | 74.6 /100 | #159 | Good 8.6% |
| Cree | 72.8 /100 | #160 | Good 8.6% |
| Albanians | 72.8 /100 | #161 | Good 8.6% |
| Immigrants | South America | 71.3 /100 | #162 | Good 8.6% |
| Immigrants | Guatemala | 68.4 /100 | #163 | Good 8.7% |
| Paraguayans | 62.2 /100 | #164 | Good 8.7% |
| Immigrants | Dominican Republic | 61.4 /100 | #165 | Good 8.7% |
| Immigrants | Belize | 57.6 /100 | #166 | Average 8.7% |
| Immigrants | Eastern Africa | 57.6 /100 | #167 | Average 8.7% |
| Immigrants | Lithuania | 57.2 /100 | #168 | Average 8.7% |