Immigrants from Albania vs Albanian Unemployment Among Seniors over 75 years
COMPARE
Immigrants from Albania
Albanian
Unemployment Among Seniors over 75 years
Unemployment Among Seniors over 75 years Comparison
Immigrants from Albania
Albanians
7.9%
UNEMPLOYMENT AMONG SENIORS OVER 75 YEARS
99.9/ 100
METRIC RATING
62nd/ 347
METRIC RANK
8.6%
UNEMPLOYMENT AMONG SENIORS OVER 75 YEARS
72.8/ 100
METRIC RATING
161st/ 347
METRIC RANK
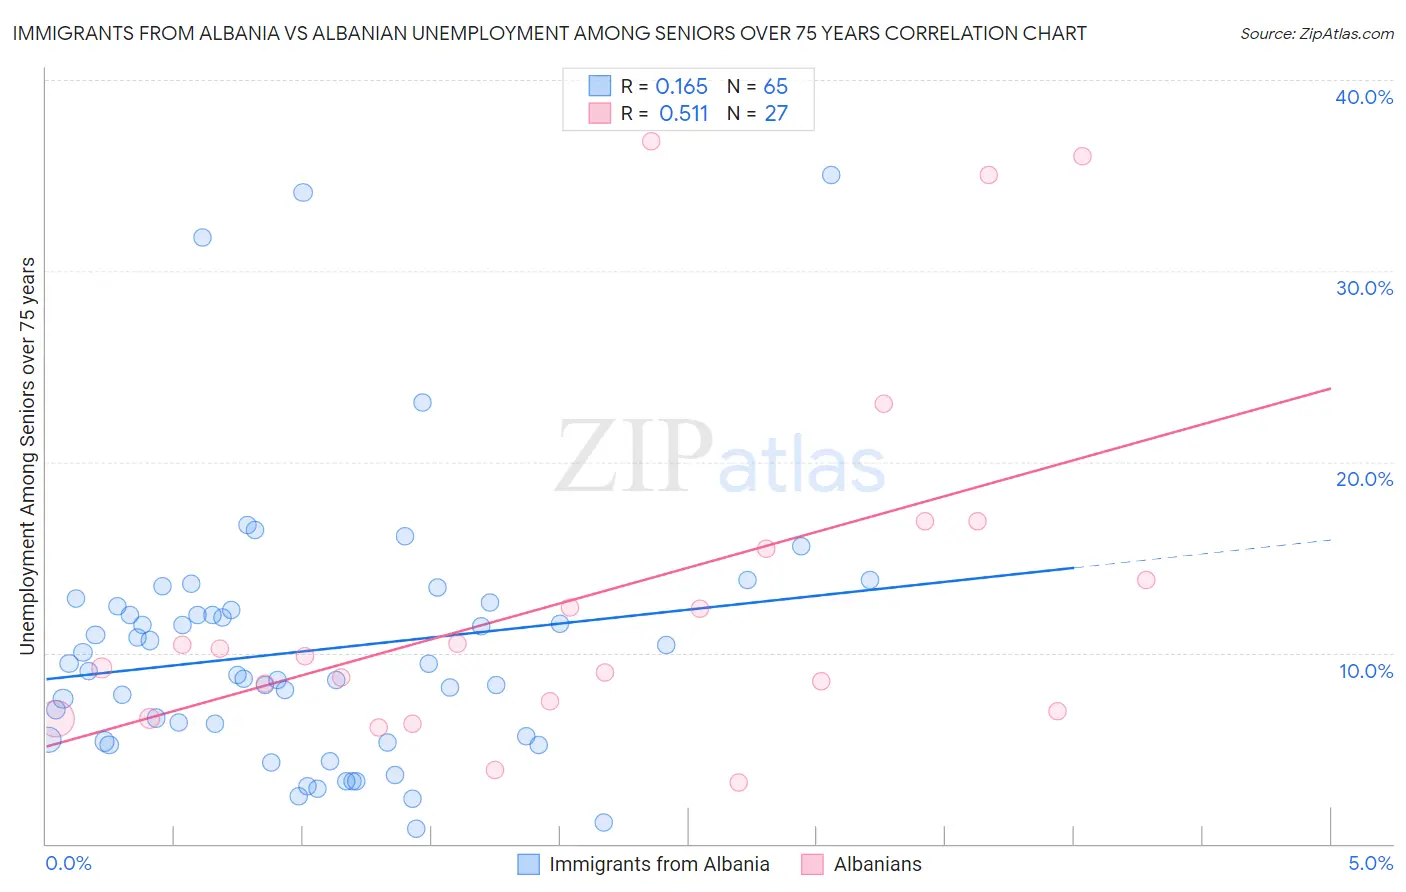
Immigrants from Albania vs Albanian Unemployment Among Seniors over 75 years Correlation Chart
The statistical analysis conducted on geographies consisting of 83,788,763 people shows a poor positive correlation between the proportion of Immigrants from Albania and unemployment rate among seniors over the age of 75 in the United States with a correlation coefficient (R) of 0.165 and weighted average of 7.9%. Similarly, the statistical analysis conducted on geographies consisting of 122,641,631 people shows a substantial positive correlation between the proportion of Albanians and unemployment rate among seniors over the age of 75 in the United States with a correlation coefficient (R) of 0.511 and weighted average of 8.6%, a difference of 8.9%.
Unemployment Among Seniors over 75 years Correlation Summary
| Measurement | Immigrants from Albania | Albanian |
| Minimum | 0.80% | 3.2% |
| Maximum | 35.0% | 36.8% |
| Range | 34.2% | 33.5% |
| Mean | 10.1% | 13.0% |
| Median | 9.0% | 9.8% |
| Interquartile 25% (IQ1) | 5.4% | 6.9% |
| Interquartile 75% (IQ3) | 12.3% | 15.4% |
| Interquartile Range (IQR) | 6.9% | 8.5% |
| Standard Deviation (Sample) | 6.8% | 9.3% |
| Standard Deviation (Population) | 6.7% | 9.2% |
Similar Demographics by Unemployment Among Seniors over 75 years
Demographics Similar to Immigrants from Albania by Unemployment Among Seniors over 75 years
In terms of unemployment among seniors over 75 years, the demographic groups most similar to Immigrants from Albania are Uruguayan (7.9%, a difference of 0.030%), Immigrants from Morocco (7.9%, a difference of 0.060%), Immigrants from Nicaragua (7.9%, a difference of 0.070%), Indonesian (7.9%, a difference of 0.11%), and Immigrants from Taiwan (7.9%, a difference of 0.13%).
| Demographics | Rating | Rank | Unemployment Among Seniors over 75 years |
| Filipinos | 99.9 /100 | #55 | Exceptional 7.9% |
| Immigrants | Eastern Asia | 99.9 /100 | #56 | Exceptional 7.9% |
| Ottawa | 99.9 /100 | #57 | Exceptional 7.9% |
| Iranians | 99.9 /100 | #58 | Exceptional 7.9% |
| Indonesians | 99.9 /100 | #59 | Exceptional 7.9% |
| Immigrants | Morocco | 99.9 /100 | #60 | Exceptional 7.9% |
| Uruguayans | 99.9 /100 | #61 | Exceptional 7.9% |
| Immigrants | Albania | 99.9 /100 | #62 | Exceptional 7.9% |
| Immigrants | Nicaragua | 99.9 /100 | #63 | Exceptional 7.9% |
| Immigrants | Taiwan | 99.9 /100 | #64 | Exceptional 7.9% |
| Argentineans | 99.9 /100 | #65 | Exceptional 7.9% |
| Immigrants | Austria | 99.9 /100 | #66 | Exceptional 8.0% |
| Immigrants | Syria | 99.9 /100 | #67 | Exceptional 8.0% |
| Immigrants | South Africa | 99.9 /100 | #68 | Exceptional 8.0% |
| Indians (Asian) | 99.9 /100 | #69 | Exceptional 8.0% |
Demographics Similar to Albanians by Unemployment Among Seniors over 75 years
In terms of unemployment among seniors over 75 years, the demographic groups most similar to Albanians are Cree (8.6%, a difference of 0.0%), Immigrants from South America (8.6%, a difference of 0.10%), Shoshone (8.6%, a difference of 0.13%), Ethiopian (8.6%, a difference of 0.17%), and Immigrants from Bahamas (8.6%, a difference of 0.26%).
| Demographics | Rating | Rank | Unemployment Among Seniors over 75 years |
| Immigrants | Pakistan | 79.7 /100 | #154 | Good 8.6% |
| Ecuadorians | 78.5 /100 | #155 | Good 8.6% |
| Immigrants | Bahamas | 76.5 /100 | #156 | Good 8.6% |
| Turks | 76.4 /100 | #157 | Good 8.6% |
| Ethiopians | 75.3 /100 | #158 | Good 8.6% |
| Shoshone | 74.6 /100 | #159 | Good 8.6% |
| Cree | 72.8 /100 | #160 | Good 8.6% |
| Albanians | 72.8 /100 | #161 | Good 8.6% |
| Immigrants | South America | 71.3 /100 | #162 | Good 8.6% |
| Immigrants | Guatemala | 68.4 /100 | #163 | Good 8.7% |
| Paraguayans | 62.2 /100 | #164 | Good 8.7% |
| Immigrants | Dominican Republic | 61.4 /100 | #165 | Good 8.7% |
| Immigrants | Belize | 57.6 /100 | #166 | Average 8.7% |
| Immigrants | Eastern Africa | 57.6 /100 | #167 | Average 8.7% |
| Immigrants | Lithuania | 57.2 /100 | #168 | Average 8.7% |