Immigrants from Croatia vs Albanian Unemployment Among Seniors over 75 years
COMPARE
Immigrants from Croatia
Albanian
Unemployment Among Seniors over 75 years
Unemployment Among Seniors over 75 years Comparison
Immigrants from Croatia
Albanians
8.3%
UNEMPLOYMENT AMONG SENIORS OVER 75 YEARS
97.2/ 100
METRIC RATING
121st/ 347
METRIC RANK
8.6%
UNEMPLOYMENT AMONG SENIORS OVER 75 YEARS
72.8/ 100
METRIC RATING
161st/ 347
METRIC RANK
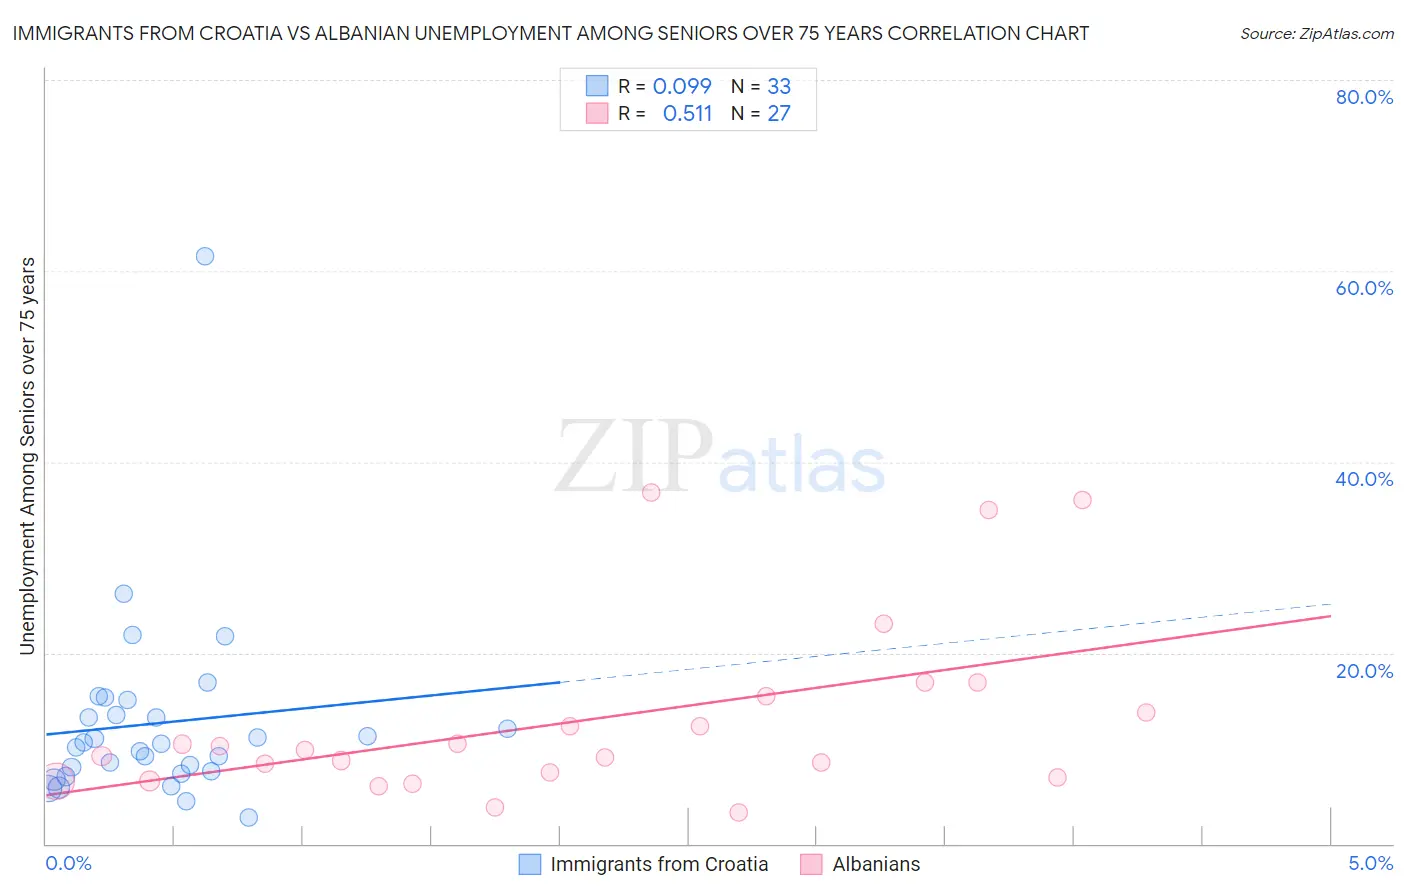
Immigrants from Croatia vs Albanian Unemployment Among Seniors over 75 years Correlation Chart
The statistical analysis conducted on geographies consisting of 94,513,732 people shows a slight positive correlation between the proportion of Immigrants from Croatia and unemployment rate among seniors over the age of 75 in the United States with a correlation coefficient (R) of 0.099 and weighted average of 8.3%. Similarly, the statistical analysis conducted on geographies consisting of 122,641,631 people shows a substantial positive correlation between the proportion of Albanians and unemployment rate among seniors over the age of 75 in the United States with a correlation coefficient (R) of 0.511 and weighted average of 8.6%, a difference of 3.6%.
Unemployment Among Seniors over 75 years Correlation Summary
| Measurement | Immigrants from Croatia | Albanian |
| Minimum | 2.8% | 3.2% |
| Maximum | 61.5% | 36.8% |
| Range | 58.7% | 33.5% |
| Mean | 12.6% | 13.0% |
| Median | 10.5% | 9.8% |
| Interquartile 25% (IQ1) | 7.4% | 6.9% |
| Interquartile 75% (IQ3) | 14.2% | 15.4% |
| Interquartile Range (IQR) | 6.8% | 8.5% |
| Standard Deviation (Sample) | 10.2% | 9.3% |
| Standard Deviation (Population) | 10.0% | 9.2% |
Similar Demographics by Unemployment Among Seniors over 75 years
Demographics Similar to Immigrants from Croatia by Unemployment Among Seniors over 75 years
In terms of unemployment among seniors over 75 years, the demographic groups most similar to Immigrants from Croatia are Immigrants from Russia (8.3%, a difference of 0.070%), Immigrants from Asia (8.3%, a difference of 0.13%), Japanese (8.3%, a difference of 0.15%), Immigrants from Nepal (8.3%, a difference of 0.15%), and Thai (8.3%, a difference of 0.19%).
| Demographics | Rating | Rank | Unemployment Among Seniors over 75 years |
| Trinidadians and Tobagonians | 98.4 /100 | #114 | Exceptional 8.3% |
| Sudanese | 98.2 /100 | #115 | Exceptional 8.3% |
| Immigrants | West Indies | 98.1 /100 | #116 | Exceptional 8.3% |
| Immigrants | Greece | 97.9 /100 | #117 | Exceptional 8.3% |
| Immigrants | Middle Africa | 97.9 /100 | #118 | Exceptional 8.3% |
| Japanese | 97.5 /100 | #119 | Exceptional 8.3% |
| Immigrants | Asia | 97.4 /100 | #120 | Exceptional 8.3% |
| Immigrants | Croatia | 97.2 /100 | #121 | Exceptional 8.3% |
| Immigrants | Russia | 97.1 /100 | #122 | Exceptional 8.3% |
| Immigrants | Nepal | 96.9 /100 | #123 | Exceptional 8.3% |
| Thais | 96.8 /100 | #124 | Exceptional 8.3% |
| Immigrants | Moldova | 96.7 /100 | #125 | Exceptional 8.3% |
| Belizeans | 96.3 /100 | #126 | Exceptional 8.4% |
| Hondurans | 96.2 /100 | #127 | Exceptional 8.4% |
| Native Hawaiians | 96.1 /100 | #128 | Exceptional 8.4% |
Demographics Similar to Albanians by Unemployment Among Seniors over 75 years
In terms of unemployment among seniors over 75 years, the demographic groups most similar to Albanians are Cree (8.6%, a difference of 0.0%), Immigrants from South America (8.6%, a difference of 0.10%), Shoshone (8.6%, a difference of 0.13%), Ethiopian (8.6%, a difference of 0.17%), and Immigrants from Bahamas (8.6%, a difference of 0.26%).
| Demographics | Rating | Rank | Unemployment Among Seniors over 75 years |
| Immigrants | Pakistan | 79.7 /100 | #154 | Good 8.6% |
| Ecuadorians | 78.5 /100 | #155 | Good 8.6% |
| Immigrants | Bahamas | 76.5 /100 | #156 | Good 8.6% |
| Turks | 76.4 /100 | #157 | Good 8.6% |
| Ethiopians | 75.3 /100 | #158 | Good 8.6% |
| Shoshone | 74.6 /100 | #159 | Good 8.6% |
| Cree | 72.8 /100 | #160 | Good 8.6% |
| Albanians | 72.8 /100 | #161 | Good 8.6% |
| Immigrants | South America | 71.3 /100 | #162 | Good 8.6% |
| Immigrants | Guatemala | 68.4 /100 | #163 | Good 8.7% |
| Paraguayans | 62.2 /100 | #164 | Good 8.7% |
| Immigrants | Dominican Republic | 61.4 /100 | #165 | Good 8.7% |
| Immigrants | Belize | 57.6 /100 | #166 | Average 8.7% |
| Immigrants | Eastern Africa | 57.6 /100 | #167 | Average 8.7% |
| Immigrants | Lithuania | 57.2 /100 | #168 | Average 8.7% |